You can use this model in the Detect Objects Using Deep Learning tool available in the Image Analyst toolbox in ArcGIS Pro. Follow the steps below to use the model for detecting wind turbines in aerial images.This model can also be fine-tuned using Train Deep Learning Model tool. See Fine-tune the model page for details on how to fine-tune this model.
Complete the following steps to detect wind turbines from the imagery:
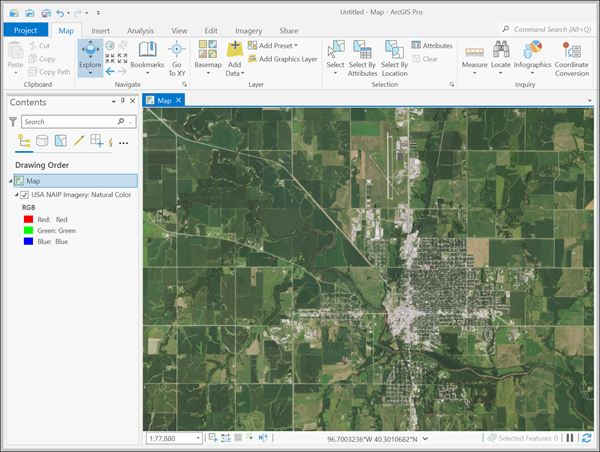
- Download the Wind Turbine Detection model and add the imagery layer in ArcGIS Pro.
- Zoom to an area of interest.

- Browse to Tools on the Analysis tab.

- Click the Toolboxes tab in the Geoprocessing pane, select Image Analyst Tools, and browse to the Detect Objects Using Deep Learning tool under Deep Learning.

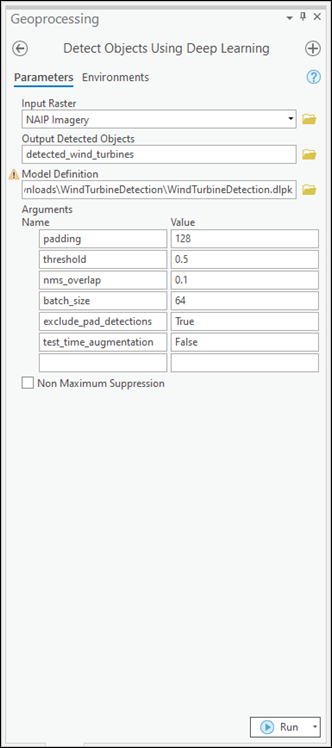
- Set the variables on the Parameters tab as follows:
- Input Raster—Select the imagery.
- Output Detected Objects—Set the output feature class that will contain the detected objects.
- Model Definition—Select the pretrained or fine-tuned model .dlpk file.
- Model Arguments (optional)—Change the values of the arguments if
required.
- padding—The number of pixels at the border of image tiles from which predictions are blended for adjacent tiles. Increase its value to smooth the output while reducing edge artifacts. The maximum value of the padding can be half of the tile size value.
- threshold—The predictions above this confidence score are included in the result. The allowed value ranges from 0 to 1.0.
- nms_overlap—The maximum overlap ratio for two overlapping features, which is defined as the ratio of intersection area over union area. The default is 0.1.
- batch_size—The number of image tiles processed in each step of the model inference. This depends on the memory of your graphic card.
- exclude_pad_detection—Specifies whether to exclude potentially truncated bounding boxes that are at the edge of each tile in the padded region. The default is True.
- test_time_augmentation—Performs test time augmentation while predicting. This is a technique used to improve the robustness and accuracy of model predictions. It involves applying data augmentation techniques during inferencing, which means generating multiple slightly modified versions of the test data and aggregating the predictions. If true, predictions of flipped and rotated orientations of the input image will be merged into the final output and their confidence values are averaged. This may cause the confidence to fall below the threshold for objects that are only detected in a few orientations of the image.
- Non Maximum Suppression—Optionally, check the check box to remove the overlapping features with lower confidence.
If checked, do the following:
- Set Confidence Score Field.
- Set Class Value Field (optional).
- Set Maximum Overlap Ratio (optional).

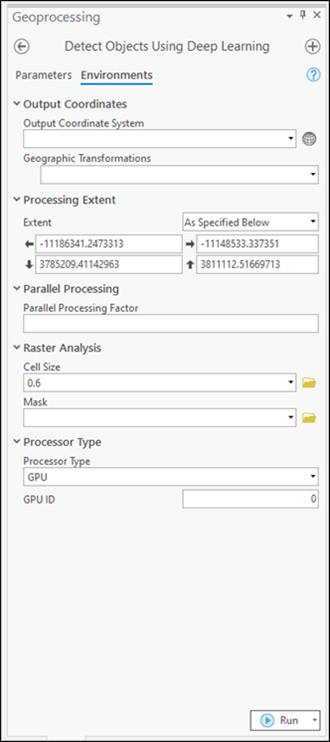
- Set the variables on the Environments tab as follows:
- Processing Extent—Select Current Display Extent or any other option from the drop-down menu.
- Cell Size (required)—Set the value to 0.6.
The expected raster resolution is 0.6 meters.
- Processor Type—Select CPU or GPU.
It is recommended that you select GPU, if available, and set GPU ID to the GPU to be used.

- Click Run.
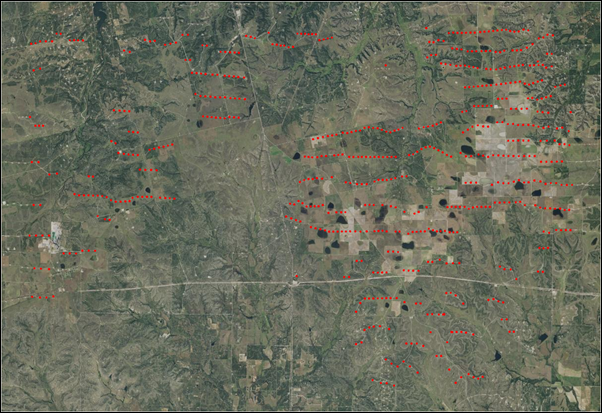
The output layer is added to the map.
