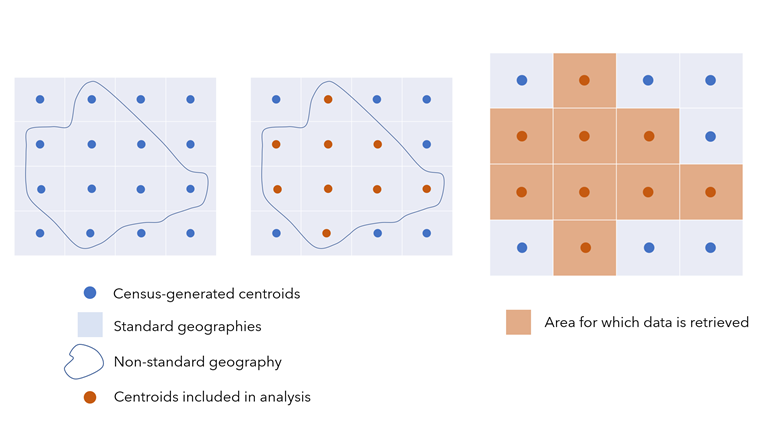
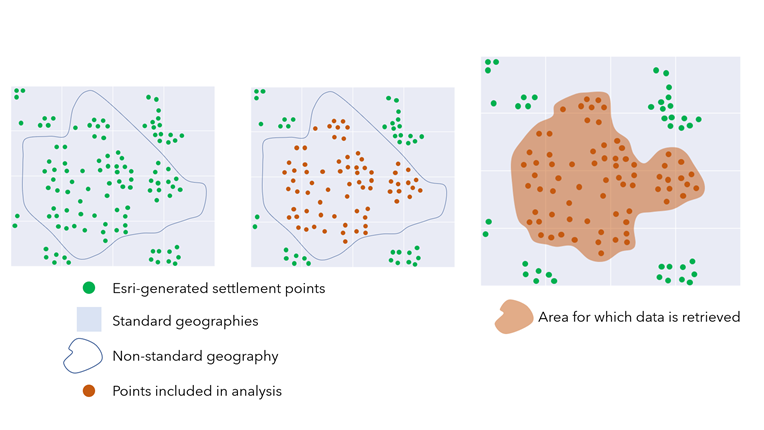
Data apportionment in Business Analyst Web App is the summarization (or aggregation) of data into rings and polygons. Data apportionment allows you to use attributes available within census geographies, such as total population, to calculate information for your custom defined areas, such as rings or drive-time service areas.
Data apportionment in Business Analyst Web App
ArcGIS software uses a process called GeoEnrichment to provide demographic data about areas on the map. For standard geographies, such as census tracts and block groups, retrieving data is simplified because the information is already reported in these units by the agency providing the data (for example, the U.S. Census Bureau). Areas that you create on the map—by drawing a polygon, importing a shapefile, or adding buffers around a site—are considered non-standard geographies, and the process of retrieving data for these areas is slightly more complex.
For non-standard geographies, data must be apportioned, or distributed and summarized, into different units than it was originally reported in. Data apportionment uses Esri-generated settlement points to provide more detail for unique areas you create on the map.
To compare, an analysis that uses data available directly from the U.S. Census Bureau would rely on census-generated centroids. A centroid is the representative center of a feature, marked by a single point. If the area you draw on the map includes a centroid, the analysis would retrieve data for the entire unit, resulting in imprecise data retrieval.

But where do people actually live within a standard geography? In most cases, they're not all clustered around the centroid. An analysis that uses (Esri-generated) settlement points apportions data to smaller units based on geographic settlement patterns. This results in data being retrieved for an area that more closely aligns with the shape drawn, based on people's actual locations.

Settlement points
Settlement points are points representing the population density of a location. Settlement points are unique because they are weighted. They represent where people live within the standard geography unit, and they assign a weight to the point based on how many people likely live there. In contrast, census centroids are broader measures that summarize the population of a standard geography—if the polygon you draw intersects with the centroid, the data for the whole geography is scooped into the data returned for your polygon. This means the data summarizes the entire geographic unit, even if your polygon only intersects with it a little bit.
Esri uses a few methods for plotting settlement points, depending on the country. To learn about the methodologies, see How data apportionment works.
Apportionment bases
Settlement points are associated with two types of demographic counts: population data and households data. Population data reflects the number of individuals, while households data reflects the number of households people have residentially grouped themselves into. Because settlement points provide data at both the population and household level, other demographic variables can be apportioned using these bases. For example, education variables are based on the population, while household income variables are based on households.
Limitations
There are some geographic-level limitations of data apportionment in Business Analyst Web App.
Data should only be summarized at its original geographic level or higher. Higher geographic levels cover larger areas, such as states, compared to smaller geographic levels, such as census blocks. For instance, some American Community Survey (ACS) variables are only available at the census tract or higher levels of geography. Smaller geographic levels, such as at the block group level, may not have ACS variable values. Therefore, ACS data cannot be apportioned at these smaller geographic levels. As a result, when building custom reports and benchmark comparisons, the ACS variables available depend on the geographic level being used.
If you summarize data at a geographic level lower than the original data, assumptions are introduced into your analysis. For instance, if you have county-level data and summarize it down to census-tract level, your data is distributed based on your set apportionment method. When summarizing data at a geographic level lower than the original data, the distribution of your data may seem overgeneralized depending on the area of interest.
When an area is sparsely populated, apportioning data becomes more difficult. The smallest geographic unit used for data apportionment in GeoEnrichment is census blocks. If the area of your analysis is very small and does not intersect any census block data, the GeoEnrichment service returns zero values. To learn more about how data is summarized, see How data apportionment works.
Resources
To learn more about data apportionment, see the following resources: