Note:
This tool is now available in Map Viewer, the modern map-making tool in ArcGIS Online. To learn more, see Aggregate Points (Map Viewer).
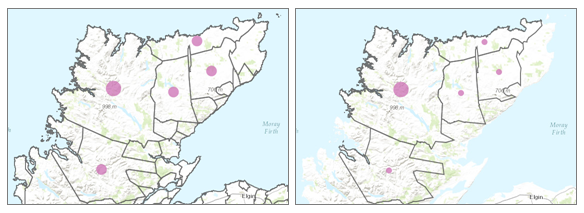
 The Aggregate Points tool uses area features to summarize a set of point features. The boundaries from the area feature are used to collect the points within each area and use them to calculate statistics. The resulting layer displays the count of points within each area using graduated symbols.
Note:
Spatial aggregation is one method for visualizing high-density data. For more information, as well as an overview of other methods, see Best practices for visualizing high-density data.
Workflow diagram

Examples
Tornadoes are the most violent type of storm that occurs in the United States. You want to know the effect of tornadoes, including loss of life, injuries, property damage, and financial loss, in each state and county. You have access to tornado locations across the United States, but you need a better way to visualize your data within the boundaries of your choice. You can aggregate your tornado data into state and county boundaries and normalize your data by population to find the areas most affected by tornadoes.
See the Twister! United States tornadoes case study for the complete workflow.
Tip:
ArcGIS Living Atlas of the World state and county layers include population data and can be used to aggregate your tornado data.
Usage notes
Aggregate Points is designed to collect and summarize point features within a set of boundaries. The input parameters must include points to be aggregated and aggregation areas.
You can provide the area layer to use for analysis, or you can generate bins of a specified size and shape (hexagon or square) into which to aggregate. The bin size specifies how large the bins are. If you are aggregating into hexagons, the size is the height of each hexagon and the width of the resulting hexagon will be 2 times the height divided by the square root of 3. If you are aggregating into squares, the bin size is the height of the square, which is equal to the width.

Tip:
You can add a layer that is not in Map Viewer Classic to the tool pane by selecting Choose Analysis Layer on the drop-down menu.
The Keep areas with no points box is checked by default. When the box is checked, all of the areas used in the analysis will be included in the result, regardless of the location of points. Areas with no points will be empty and have a count of 0. When the box is unchecked, the areas with no points are completely removed from the result layer. Unchecking the box may have a significant effect on the result areas.

The most basic aggregations will calculate a count of the number of points in each boundary. Basic statistics (sum, minimum, maximum, average, and standard deviation) can also be calculated on numerical fields. The statistics will be calculated on each area separately.
Statistical calculations can also be grouped using a field with categorical values. When statistics are grouped by a field, the statistics are calculated for both the area as a whole and for each group. Both statistics can be viewed in the result layer's pop-up. The overall statistics are given numerically and the grouped statistics are given in chart form within the pop-up. A summary table listing each feature and statistic by group by field value will also be created. The Add minority, majority check box will return the groups with the lowest and highest counts and the Add percentages check box will return the percentage of points in the minority and majority groups.
If Use current map extent is checked, only the features in the input point layer and area layer visible within the current map extent will be analyzed. If unchecked, all features in both the input point layer and the area layer will be analyzed, even if they are outside the current map extent.
Tip:
Click Show Credits before you run your analysis to check how many credits will be consumed.
Limitations
Inputs must include a point layer and an area layer. Lines and areas cannot be aggregated within boundaries using the Aggregate Points tool.
How Aggregate Points works
The sections below describe the functionality of the Aggregate Points tool.
Generating bins
Square and hexagonal bins can be generated for aggregation areas rather than aggregating points into an input area layer. The bins are generated in a custom, area-preserving projected coordinate system using the specified size dimensions to ensure the sizes are equal and appropriate for the area of interest. An appropriate equal-area projection and parameters are chosen based on the geographic extent of the input layers. Once bins are created, they are projected back to the coordinate system of the input data before being used in the analysis.
After the analysis is complete, the result is projected to Web Mercator for display (the default) or to the projection of your custom basemap. A Web Mercator projection may cause your results to appear distorted, especially for large bins or bins near the polar regions. These distortions are part of the display only and do not reflect an inaccurate analysis.
Equations
Standard deviation is calculated using the following equation:

where:
- N = Number of observations
- xi = Observations
- x̄ = Mean
Calculations
Point layers are summarized using only the point features within the input boundary. The results will be displayed using graduated symbols.
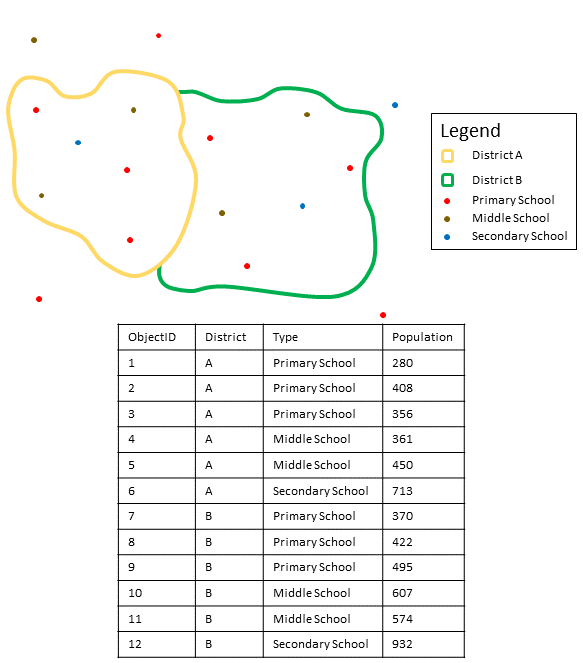
The figure and table below explain the statistical calculations of a point layer within a hypothetical boundary. The Population field was used to calculate the statistics (Sum, Minimum, Maximum, Average, and Std Deviation) for the layer.

| Statistic | Result District A |
|---|---|
Sum | |
Minimum | Minimum of: |
Maximum | Maximum of: |
Average | |
Std Deviation |  |
Note:
Null values are excluded from all statistical calculations. For example, the mean of 10, 5, and a null value is 7.5 ((10+5)/2).
A real-life scenario in which this analysis could be used is in determining the total number of students in each school district. Each point represents a school. The Type field gives the type of school (elementary, middle school, or secondary) and a student population field gives the number of students enrolled at each school. The calculations and results are given for District A in the table above. From the results, you can see that District A has 2,568 students. When running the Aggregate Points tool, the results would also be given for District B.
Similar tools
Use Aggregate Points to summarize points within areas. Other tools may be useful in solving similar but slightly different problems.
Map Viewer Classic analysis tools
If you are trying to summarize lines or areas, use the Summarize Within tool.
ArcGIS Pro analysis tools
Aggregate Points performs the functions of the Spatial Join and Summary Statistics tools.