Note:
You need the following account and license types to use the ArcGIS for Power BI user interface (UI):
- Microsoft license—You need a Microsoft 365 license to access some edit mode items.
- ArcGIS account type—Standard users can use many ArcGIS for Power BI features, but the use of premium features requires an ArcGIS account. Sign in to an ArcGIS account to access premium features or to change the UI configurations.
The ArcGIS for Power BI UI is described.
See Get started with ArcGIS for Power BI to learn more about ArcGIS for Power BI maps.
ArcGIS for Power BI provides two environments when viewing and working with the map visualizations: reading view and edit mode.
- Reading view—When you view a report or dashboard enabled for ArcGIS for Power BI in reading view, you see the map as it was designed by the user who created it (Contributor role or higher). Depending on how the map permissions were established, you may not have access to all of the map's features.
- Edit mode—When you work with a report in edit mode, you have access to all Microsoft Power BI visualizations, including ArcGIS for Power BI. You have access to several tools you can use to create a map using the visualization's map tools and the Power BI Build visual and Format visual panes.
Your Microsoft role, managed by your system administrator, determines whether you have privileges to edit ArcGIS for Power BI maps with your ArcGIS for Microsoft 365 license.
If you are signed in to your ArcGIS account, you have access to more features than those available to Standard users, including more basemaps, reference layers, and demographics. For more information about the differences in account, license, and role types, see Accounts.
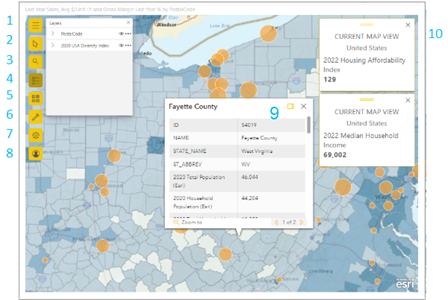
The UI items available in reading view and edit mode are described below; customizations and differences are indicated where applicable. The numbers correspond to the numbers in the image.

| Number | UI item | Reading view | Edit mode |
|---|---|---|---|
1 | Map tools | Expand the toolset | |
2 | Selection tools | Expand the toolbar and view the available selection tools. | |
3 | Search | Find an address or point of interest and pin its location on the map. | |
If the Search tool does not appear, the Contributor has turned off this functionality. | Contributors control whether the Search tool appears in the map tools from the visualization's Format visual pane. | ||
4 | Layers list | Show or hide the contents of the list on the map. Each map layer appears in the list as a separate item with its own set of tools. | |
Expand each layer item to view its legend. | Expand each layer item to see the available options. You can style, edit, or change the available layer data. | ||
5 | Basemap | If enabled by the Contributor, you can temporarily change the basemap used in the map. | Choose from a gallery of background maps. |
6 | Analysis tools | This item appears only if the Contributor has included data to perform a Find similar analysis. | Add infographics cards or reference layers to the map, specify a Buffer/Drive-time analysis area, or configure a Find similar analysis. |
7 | Settings | Access the ArcGIS for Power BI online help, publish or run an embed check on a map, view map attribution details, and specify Esri User Experience Improvement preferences. | |
8 | Profile | View details about your ArcGIS account. | |
9 | Tooltips | Hover over locations on the map to view information about that location. | |
10 | Infographics cards | These cards display demographic information about the currently visible area of the map or the areas surrounding currently selected points on the map. Infographics cards appear only if the Contributor has configured them in the map design. | |
Edit mode options
With the report in edit mode, you can use the visualization's tabs to customize your ArcGIS for Power BI content on the Build visual and Format visual panes.
Build visual pane
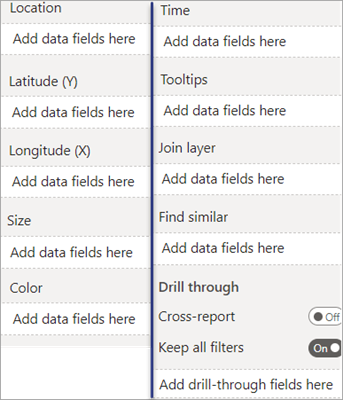
You can use the options in the ArcGIS for Power BI visualization's Build visual pane to specify the location data used to create the map, as well as customize how the map is rendered. The options are described below.

- Location—Drag location-based values from the data to this field well to display locations on the map.
- Latitude (Y)—Drag a latitude (y) value from the data into this field well to define a latitude map coordinate. If you use this option, you must also specify the corresponding longitude (x) value.
- Longitude (X)—Drag a longitude (x) value from the data into this field well to define a longitude map coordinate. If you use this option, you must also specify the corresponding latitude (y) value.
- Size—Drag numeric data into this field well to draw locations on the map according to their size.
- Color—Drag numeric or categorical data into this field well to show locations by color. For example, use different colors to represent customer language preferences.
- Time—Drag temporal data (date, time, or date and time) into this field well to animate locations on the map according to time. This option is often used with weather and climate maps, sales data over time, traffic data, and other temporally-affected maps. See Time-aware data for more information.
- Tooltips—Drag categorical or numeric data into this field well to add information to the tooltips shown for locations on the map. You can drag multiple values into this field well or drag the same value multiple times and apply a different aggregation method. For example, drag a numeric field into this field well three times, and calculate the sum for one, the average for another, and the minimum for the third. Each of the fields appears in the tooltip with the appropriate label and value.
Note:
Tooltips appear in the order you add them to the field well.
- Join layer—Link data attributes from Power BI to those from a reference layer added from ArcGIS to provide greater insight into the data. Join the data layer and the reference layer by linking common attributes in each dataset in the Join layer field well. To use this option, the data must include attributes that align with attributes from the reference layer (numbers to numbers, strings to strings, and so on). You can join up to five attributes. See Join layers for more information.
- Find similar—Drag up to five data fields into this field well to identify the top 10 locations with attributes comparable to locations selected on the map. See Find similar locations for more information.
- Drill through—Allow other Power BI visualizations to access the map. Turn on the Cross-report toggle button to use the map as a drill-through destination. Turn on the Keep all filters toggle button to allow drill through to the report for all data, or add specific fields to this field well to select the data that has drill-through permissions. See Add drill through for more information.
Format visual pane
Options in the ArcGIS for Power BI visualization's Format visual pane allow Contributors to customize how the map appears to Viewers. Available options in the pane are described below. Expand each category in the pane to access the available options.
Note:
For each category, click Reset to default to discard your changes and return to the default settings.
Layers category
Options in the Layers category allow you to customize the Layers list.
- Title—Change the title of the Layers list.
- Show layers—Specify the visibility of the Layers list. If you turn this off, the Layers list does not appear on the map and the Layers button does not appear in the map tools. Show layers is on by default.
- Anchor—Turn this on to pin the Layers list in position on the map. When this option is on, the Layers button
 does not appear in the map tools.
 - Layers position—Specify where the Layers list appears on the map. By default, the list appears on the left.
Map tools category
You can customize map navigation and the position of infographics cards on the map using the options in the Map tools category .
- Zoom tools—Display navigation buttons on the map. This setting is off by default.
- Basemaps—Display the Basemap tool in the map tools to allow viewers to temporarily change the basemap. This setting is off by default.
Note:
When the Basemap tool is turned off and you drag data into a Power BI field well, the Basemap tool is automatically turned on. Clearing the field well or clicking Reset to default removes the Basemap tool from the map tools.
- Lock extent—Turn off automatic map zoom. When the map extent is locked, events that cause a selection change on the map or filters applied to the data do not change the map display. Viewers cannot zoom or pan the map.
- Infographics position—Specify where infographics cards appear on the map. By default, infographics cards appear in the upper right corner.
Location type category
You can specify the country where the data is located using the Country drop-down menu in the Location type category. If the data is located in multiple countries, choose World.
Search category
From the Search category, you can display the Search button  in the map tools. This option is on by default.
Layer options
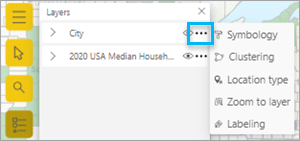
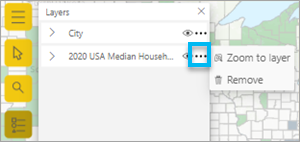
Map layers appear in the Layers list. Different menu options are available, depending on the type of the active layer. Contributors can change the style and location type of map layers created with Power BI data. Contributors can remove reference layers added from ArcGIS, Buffer/Drive time analysis layers, and search result layers. Contributors can rename a layer and zoom to its full extent.


The first image above shows the layer options available for layers created using Power BI data. The second image shows the layer options available for a reference layer added from ArcGIS.