Converts a trend raster to a three-band (red, green, and blue) raster. The trend raster is generated from the Generate Trend raster function or the CCDC Analysis raster function.
Notes
This function is useful for visualizing model coefficient data from the Generate Trend function or the CCDC Analysis function. Both functions estimate trends in changing pixel values, but the results of the functions are difficult to interpret directly.
This function can also be used to visualize the outputs from the Generate Trend Raster and Analyze Changes Using CCDC geoprocessing tools.
Like many raster functions, you may need to use the Dynamic Range Adjustment (DRA) option to better display the results of this function.
There are two model conversion options:
- Linear—The linear trend information from the model is converted to RGB. Use this option to visualize the slope and intercept coefficients for a linear trend model.
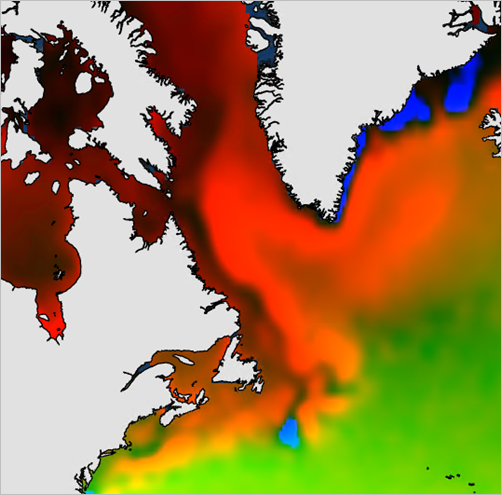
Increasing (positive) slope values are converted to red, decreasing (negative) slope values are converted to blue, and intercept values are converted to green. The intercept is the modeled pixel value at the time of the first slice. In the image below, yearly ocean temperatures in the Labrador Sea are rising and are displayed in red, while coastal waters just off the southeast coast of Greenland are decreasing and are displayed in blue.

- Harmonic—The harmonic trend information from the model is converted to RGB. Use this option to visualize the harmonic regression coefficients from the trend raster or change analysis raster. The amplitude and phase coefficients are first converted to a hue, saturation, value (HSV) color model before being converted to RGB. Hue is determined by the model phase coefficients, saturation is determined by model amplitude, and value remains constant. When the input raster is a trend raster from the Generate Trend raster function, blue and purple pixels indicate areas of high seasonal variability (for example, deciduous forest), while green and yellow indicate less seasonal variability. When the input raster is a change analysis raster from the CCDC Analysis function, water is rendered in pink, developed areas are depicted with white, blue and purple pixels indicate grassland or forest, and orange or red pixels indicate agriculture.
The Linear model conversion option is supported for the trend raster output from the Generate Trend raster function when Regression Type is set to either Linear or Harmonic, since the Harmonic regression type in the Generate Trend function also includes a linear model.
The Harmonic model conversion option is supported for the trend raster output from the Generate Trend raster function when Regression Type is set to Harmonic. It is also supported for the change analysis raster output from the CCDC Analysis raster function.
Parameters
| Parameter | Description |
|---|---|
Raster | The input trend raster. |
Model Type | The type of model information to convert to RGB.
|