In this topic
This is an archive related to a previous version of Esri Maps for IBM Cognos. If you need the current version go to http://doc.arcgis.com/en/maps-for-cognos/.
Report formats
Map-enabled reports can be viewed and printed in PDF and Excel report formats.
Viewing and printing maps in PDF and Excel report formats requires that the following work together:
- Web server (with CGI proxy)
- EM4C Server
- IBM Cognos Server
To ensure that maps are successfully generated in PDF and Excel documents, it is essential that each of these servers is configured to detect and communicate with the others. Esri Maps for IBM Cognos supports viewing and printing maps in PDF and Excel report formats by generating an image of the map that is included in the output report. The exact process by which this occurs depends on the mode of the client's web browser.
Browser canvas rendering
When a user activates the PDF or Excel report format option in any browser other than Internet Explorer Quirks mode (see the following section), a hidden canvas is created from JavaScript code. The canvas is used to hold the map image created from images fetched from ArcGIS.
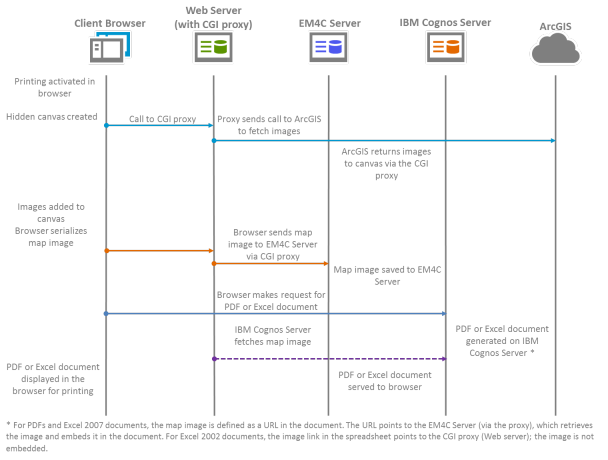
Because the canvas has a limitation that makes it unable to perform cross-domain requests for images, the browser must use a proxy on the web server to fetch the images from ArcGIS, send the generated map image to the EM4C Server, and serve the PDF or Excel document containing the map back to the browser. The following diagram illustrates the map image generation process.

As the diagram shows, once the canvas is created in the browser, the browser makes a call to the CGI proxy on the web server, which in turn sends a call to ArcGIS to fetch the images. After the images are returned and added to the canvas and the map image is serialized, the image is sent to the EM4C Server via the web server proxy and saved there. The browser then makes a request to the IBM Cognos Server for a PDF or Excel document, depending on the format chosen by the user. The IBM Cognos Server fetches the map image from the EM4C Server (via the proxy) and the PDF or Excel document containing the map image is served to the browser for display and printing.
Internet Explorer Quirks rendering
Quirks mode is a document rendering mode available in Internet Explorer (IE). Quirks mode is used to emulate the rendering behavior of IE 5 to properly display web pages developed before the implementation of modern HTML and CSS specifications.
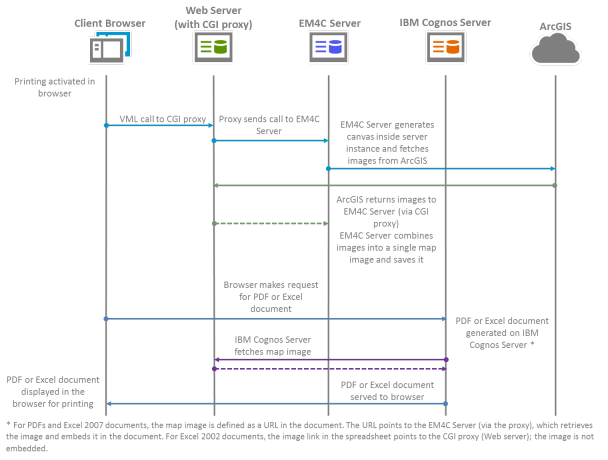
The browser canvas element described in the previous section is not present in IE Quirks mode. Instead, a canvas is generated on the EM4C Server to hold the images and create the map image. The following diagram illustrates the map image generation process.

When a user activates the PDF or Excel report format option in Internet Explorer Quirks mode, the browser uses Vector Markup Language (VML) to make a call to the CGI proxy on the web server, which then sends a call to the EM4C Server to generate the canvas inside a server instance. The EM4C Server fetches the images from ArcGIS via the CGI proxy on the web server, and the images are combined into a single map image and saved to the EM4C Server. From this point, the PDF and Excel document creation process is the same as the one described in the previous section for browser canvas rendering.
View and print a map-enabled report in a different format
Map-enabled reports can be viewed and printed in PDF and Excel report formats once the report has been run as HTML.
- Run the report in HTML.
- Click the View in HTML Format button.
- Select the desired output format.
The map is displayed in the output document.
- Print the output document if desired.