A feed is a real-time stream of data coming into ArcGIS Velocity. Feeds typically connect to external sources of observational data such as internet of things (IoT) platforms, message brokers, or third-party APIs. Feeds parse incoming tabular, point, polyline, or polygon data and expose it for analysis and visualization. A feed is also a type of stream layer and can be added to a map, allowing you to visualize information as soon as it is received.
The following feed types are available in Velocity:
- ArcGIS feed types:
- Cloud feed types:
- Web and messaging feed types:
- Data provider feed types:
Examples
The following are examples of using a feed:
- A transportation asset manager creates an Azure Event Hub feed to receive observational data from IoT sensors place on roadways.
- A GIS analyst creates a Feature Layer feed to ingest new features from a feature layer being edited by hundreds of users in a web app.
Polling and streaming feeds
Two primary types of feeds are available in ArcGIS Velocity: polling feeds and streaming feeds.
A polling feed polls the specified source of data at a user-defined interval such as every 10 seconds or every minute. Examples of polling feeds include Feature Layer, HTTP Poller, and RSS feed.
When a polling interval is set, the polling occurs on regular clock intervals, as opposed to the start time of the feed. The time interval begins at midnight local time for the user who created the feed. For example, if a feed is set to poll for data every 5 minutes and the feed is started at 8:03 a.m., the first request for data will occur at 8:05 a.m., the next at 8:10 a.m., and so on. If a feed is set to poll every 8 hours and the feed is started at 10 a.m., the first request will occur at 4 p.m., the next at midnight, and the following at 8 a.m. the next day.
A streaming feed connects to the specified source of streaming data and remains connected. Any time the data source sends additional data, the streaming feed immediately receives and processes the data into events. Examples of streaming feeds include Stream Layer, MQTT feed, and Kafka feed.
Note:
When setting up the Velocity feeds, the recurrence value for seconds can be set to a factor of 60 (between 10 and 30) for a consistent and predictable runtime.
Start and stop a feed
A feed can be in either a started (running) or stopped state. Consider the following:
- When a feed is created, the feed starts automatically.
- A feed only receives or polls its data source when it is in the started state.
- If a started feed is edited, it restarts once the edits are saved.
- When a feed is stopped, event data is not ingested.
Create a feed
To create a feed, complete the following steps:
- Open and sign in to the ArcGIS Velocity app.
- Click Create feed.
- Search for or choose a feed type from the following categories:
- ArcGIS
- Cloud
- Web and Messaging
- Data Providers
- Configure the feed configuration information.
The configuration parameters vary depending on the feed type chosen.
- Click Next to continue with the remaining steps including confirming the schema, identifying key fields, defining the polling interval (if applicable), and saving the feed.
For more information on feeds, refer to the quick lessons for configuring input data and creating a feed.
Edit a feed
An existing feed can be edited, allowing you to update connection parameters, schema configuration, key fields, and polling interval (if applicable) parameters. If the feed is running when it is edited, it automatically restarts and applies the new configuration details once it is saved.
You can edit a feed in the Velocity app by doing either of the following:
- Opening the Feeds page and clicking the edit button next to a feed
- Opening a feed's Details page and clicking the Edit button
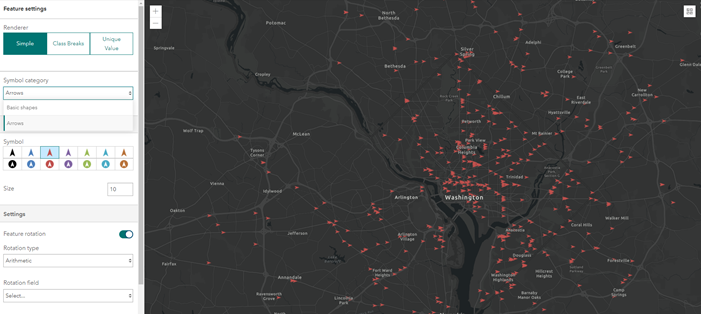
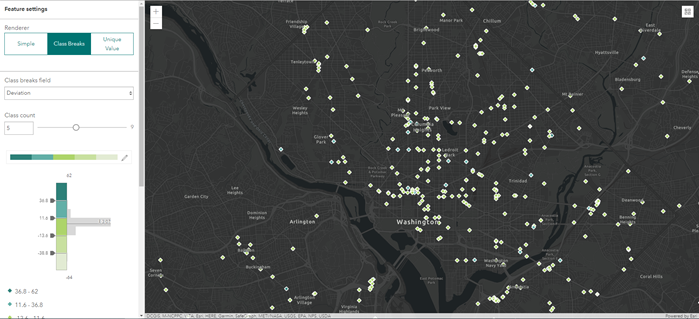
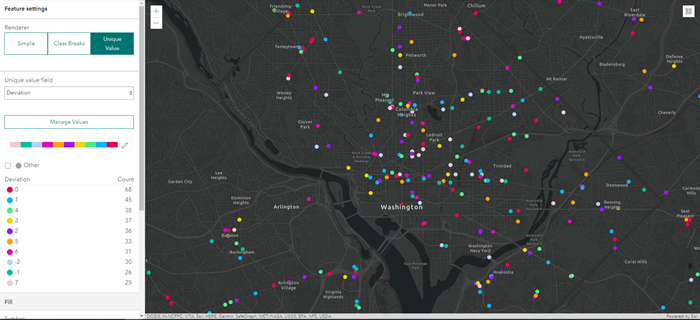
A feed's symbology can be defined once it is created and available in Velocity, allowing you to define how raw features are rendered in a web map. Individual features are only rendered when the number of features to be rendered in the active map extent is less than the feature threshold specified. Raw feature rendering of the feed is limited to simple vector symbols (circles, squares, diamonds, pointers, and more).
To edit a feed's symbology, complete the following steps:
- Open and sign in to the Velocity app.
- Click Feeds from the menu.
- Find the existing feed to edit and click it to open the Details page.
- Click Edit symbology to open the Feature settings pane.
- For Renderer, choose Simple, Class Breaks, or Unique Value and set the parameters.
Feed symbology rendering options
When editing a feed's symbology, you have several rendering options available including simple, class breaks, and unique value.
Simple
Raw features can be rendered using the Simple renderer option. The simple renderer renders all features in a stream layer with the same symbol. The simple renderer allows you to choose either Basic shapes or Arrows using the Symbol category parameter.

The Simple renderer parameters are described in the following table:
| Parameter | Description |
|---|---|
| Symbol (Fill) | The symbol style used to render features. Options are circle, square, diamond, triangle, cross, X, and pointer. |
| Size (Fill) | The size of the feature. |
| Color (Fill) | The color of the feature. |
| Color (Outline) | The color of the outline. |
| Width (Outline) | The width of the outline. |
| Feature rotation (Settings) | A slider that specifies whether features should be rotated. To rotate the feature, drag the handle of the slider, and set the values for Rotation type, Rotation field, and Rotation angle. |
| Rotation type (Settings) | The rotation type used to rotate the simple marker symbols, and it controls the origin and direction of rotation. If the rotation type is Arithmetic, the symbol is rotated from east in a counterclockwise direction, where east is the 0 degree axis. If the rotation type is Geographic, the symbol is rotated from north in a clockwise direction, where north is the 0 degree axis.
|
| Rotation field (Settings) | The degree of rotation to apply to features. |
| Rotation angle (Settings) | The angle of all features relative to the screen in degrees. |
Class breaks
Raw features can be rendered using the Class Breaks renderer option. The class breaks renderer defines the symbol for each feature in a feature layer based on the value of a numeric attribute. The numeric attribute values are used to define data ranges for the classes. Each feature is assigned a symbol based on the class break of its numeric attribute value.

The Class Breaks renderer parameters are described in the following table:
| Parameter | Description |
|---|---|
| Classify data | The classification method. Options are manual breaks, natural breaks, equal interval, standard deviation, and quantile. |
| Class breaks field | The field that is used for calculating class break values. |
| Class count | The total number of classes. The classes can be manually adjusted in the class breaks histogram. |
| Color ramp | The range of colors applied to the classes. Choose one of the color ramps or apply a unique color ramp using the fill style. |
| Class settings | The fill and outline settings for a respective class. Access the class settings by selecting a class break value. |
| Symbol (Fill) | The symbol style used to render features. Options are circle, square, diamond, triangle, cross, X, and pointer. |
| Size (Fill) | The size of the features. |
| Color (Outline) | The color of the feature outlines. |
| Width (Outline) | The width of the feature outlines. |
| Feature rotation (Settings) | A slider that specifies whether features should be rotated. To rotate the feature, drag the handle of the slider and set the values for Rotation type, Rotation field, and Rotation angle. |
| Rotation type (Settings) | The rotation type used to rotate the simple marker symbols. The rotation type controls the origin and direction of rotation. If the rotation type is Arithmetic, the symbol is rotated from east in a counterclockwise direction, where east is the 0 degree axis. If the rotation type is Geographic, the symbol is rotated from north in a clockwise direction, where north is the 0 degree axis.
|
| Rotation field (Settings) | The degree of rotation to apply to features. |
| Rotation angle (Settings) | The angle of the features relative to the screen in degrees. |
Unique value
Raw features can be rendered using the Unique Value renderer option. The unique value renderer renders all features in a stream layer based on one or more matching attributes.

The Unique Value renderer parameters are described in the following table:
| Parameter | Description |
|---|---|
| Unique value field | The field that is used for determining unique values. |
| Manage Values | Defines the unique values to symbolize. Values not present in the current dataset can be manually added. |
| Color ramp | The range of colors applied to the unique values. |
| Unique value settings | Defines the fill and outline settings for a single unique value. Access the unique value settings by selecting a unique value category. |
| Symbol (Fill) | The symbol style used to render all features. Options are circle, square, diamond, triangle, cross, X, and pointer. |
| Size (Fill) | The size of the features. |
| Color (Outline) | The color of the feature outlines. |
| Width (Outline) | The width of the feature outlines. |
| Feature rotation (Settings) | A slider that specifies whether features should be rotated. To rotate the feature, drag the handle of the slider and set the values for Rotation type, Rotation field, and Rotation angle. |
| Rotation type (Settings) | The rotation type used to rotate the simple marker symbols. The rotation type controls the origin and direction of rotation. If the rotation type is Arithmetic, the symbol is rotated from east in a counterclockwise direction, where east is the 0 degree axis. If the rotation type is Geographic, the symbol is rotated from north in a clockwise direction, where north is the 0 degree axis.
|
| Rotation field (Settings) | The degree of rotation to apply to features. |
| Rotation angle (Settings) | The angle of the features relative to the screen in degrees. |
Save a feed
Once the feed configuration parameters are set, you can save the feed. After saving the feed, the new feed is created—or if you edited an existing feed, the feed is restarted to apply any edits. Client applications that use the feed, such as Velocity, update accordingly, including any symbology changes.