In this topic
This is an archive related to a previous version of Esri Maps for SAP BusinessObjects. If you need the current version go to http://doc.arcgis.com/en/maps-for-sap-bobj/.
Configure the map as the target of a selector
With Esri Maps for SAP BusinessObjects, you can easily add interactivity between components on your dashboard by configuring selectors. Selectors allow users to filter data based on selections made when viewing the dashboard. You can insert data from a Universe query or from the embedded spreadsheet in the dashboard.
Esri Maps for SAP BusinessObjects allows you to configure a map as a target of a selector, so that actions on other dashboard components trigger a reaction on the map.
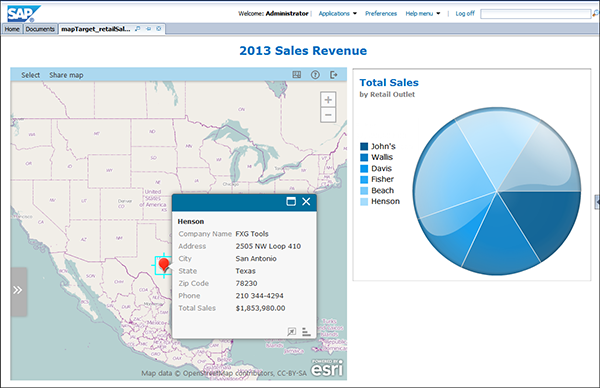
For example, you can configure a pie chart that shows total annual sales for various retail locations, and set up an insertion from the chart data. You can then bind the insertion data to an Esri map component so that it displays the locations when the user clicks on different segments of the chart.
 |
In the same manner, you can configure the Esri map component as a selector. See Configure the map as a selector.
For more information about configuring insertions, see the SAP Dashboards Online Help.
Create a map-enabled dashboard
Create a dashboard that includes an Esri map and other dashboard components.
To configure interactive behaviors on the map, your dashboard must have at least two components on the canvas, one of which must be an Esri map, and both the map and the target component must have a location-based attribute in common.
- In SAP Dashboards,
create a new dashboard.
The SAP Dashboards window displays a blank canvas and an empty spreadsheet. If you created the new model by specifying a spreadsheet, the data appears in the spreadsheet pane.
- From the Components Browser, scroll to the Esri Maps category and drag the Esri Map component onto the canvas. You can repeat this step multiple times to add additional maps; each map must be configured separately.
Configure an insertion
Configure data insertion on a dashboard component to insert data to a specified range of cells in the embedded spreadsheet or to a Universe query prompt.
For detailed information about configuring insertions, see the SAP Dashboards Online Help.
Bind data to the map
To allow your map to display data based on the user's selection on another dashboard component, you must bind the data from the other component's insertion destination to the map. The insertion destination can be a range of cells in the embedded spreadsheet or a Universe query prompt.
- Click the Esri map component to display its Properties panel. On the General tab, in the Data Sources section, click the + (plus sign) icon.
In the Source Name field, type a new name for the data source.
The name is automatically updated in the list of available data sources. This name will appear in the list of data sources available from SAP BusinessObjects in the Esri Maps Designer.
- In the Source Data section, click the Binding Selector icon and select the appropriate option for the data insertion configured for the other dashboard component.
For example, if you configured a query prompt as the insertion destination for the dashboard component, select Query Data and specify the defined data insertion destination as the Source Data for the map.
Add data to the map
After you bind the data to the map, use the Esri Maps Designer to add data to the map and configure how the map displays that data to the dashboard consumer.
Follow the workflow described in Add SAP BusinessObjects data to your map.
Configure other dashboard components
You can configure other dashboard components to interact with the map using standard SAP Dashboards configuration.
These include the following:
- Charts
- Selectors
- Single value components
- Query Prompt selectors
- Query Refresh buttons
- Configure other components on your dashboard to interact with the Esri Map.
- Save your dashboard.
- To preview the dashboard with the interactive map, save the file to your SAP BusinessObjects Business Intelligence platform and view it in BI Launch Pad, or publish it to your locally installed web server and view it in a supported browser. For more information, see Previewing a map-enabled SAP BusinessObjects dashboard.