This lesson introduces you to the various parts of the ArcGIS Velocity app and describes how they relate to each other.
This lesson is designed for beginners. You must have an ArcGIS Online account with access to Velocity. The estimated time to complete this quick lesson is 10 minutes.
Access the Velocity app
Complete the following steps to sign in to the Velocity app:
- In a web browser, open Velocity.
- Sign in with your ArcGIS organization credentials.
For the best experience, use Google Chrome or Mozilla Firefox.
Note:
If you encounter issues signing in, contact your ArcGIS Online administrator. You may need to be assigned an ArcGIS Online role with privileges to use Velocity.
Once you're signed in, the Velocity Home page appears.
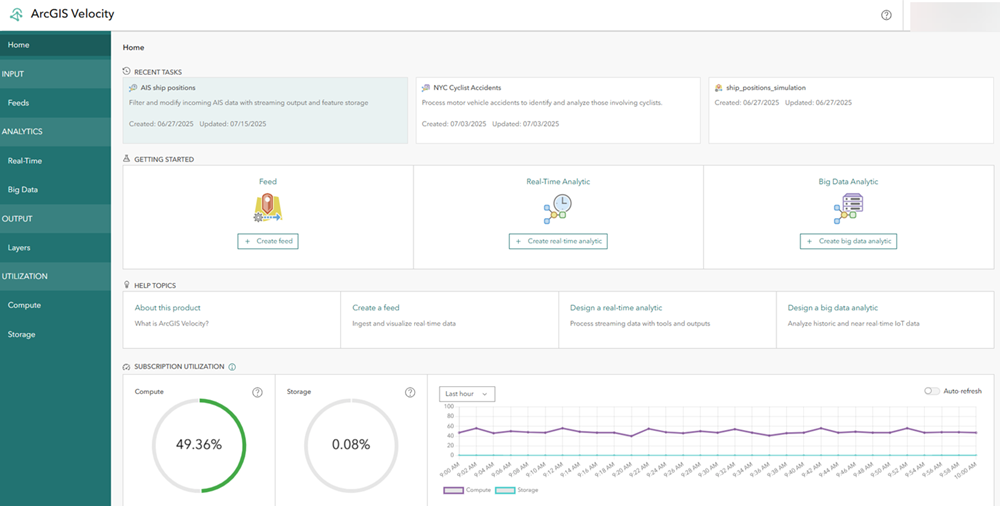
The Velocity Home page provides shortcuts to create feeds and analytics, links to available resources, and information about your Velocity subscription.
Explore and create feeds
Once you have signed in to the Velocity app, you can explore and create feeds by completing the following steps:
- Click the Feeds tab to open the Feeds page.

The Feeds page displays a list and status of any configured feeds. You can view the feeds you have created under the My Contents page. A feed type is a real-time stream of data coming into Velocity. Feeds typically connect to external sources of observational data such as Internet of Things (IoT) platforms, message brokers, and third-party APIs.
- On the Feeds page, click Create feed.
The Select a feed type window appears. You can create a feed from ArcGIS content such as a feature layer, cloud-based IoT solutions such as Azure Event Hub or AWS IoT, a web and messaging system such as an HTTP endpoint and Kafka, as well as data providers such as Verizon Connect Reveal or Geotab.
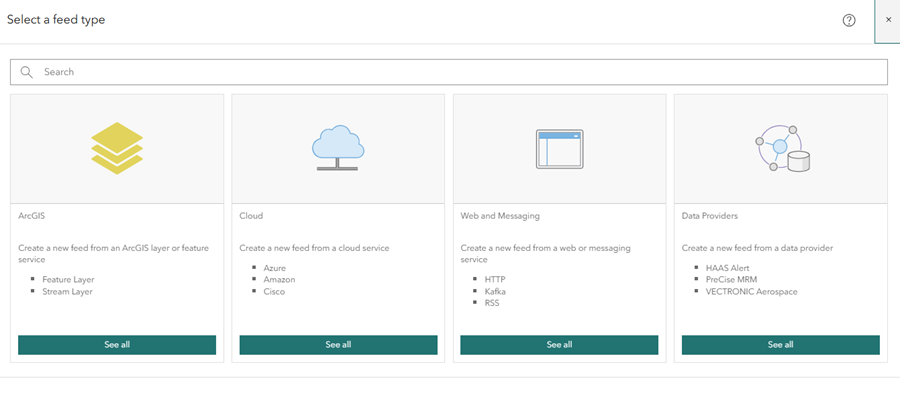
- Close the Select a feed type window.
- Familiarize yourself with the options for working with existing feeds including the following:
- Sorting the feed list by title, executable status, running status, input rate, and modified date

- Starting or stopping a feed
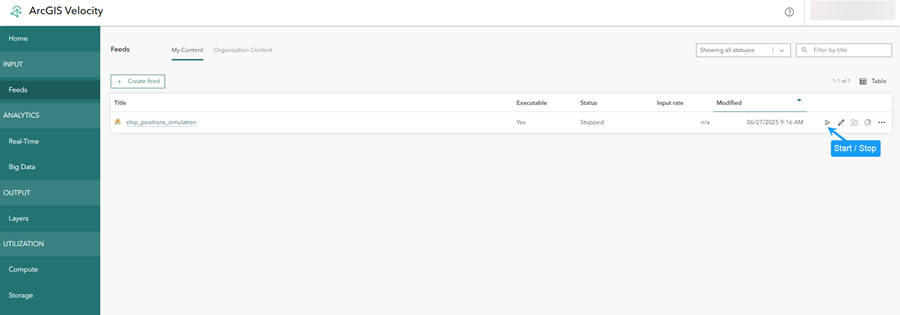
- Editing a feed
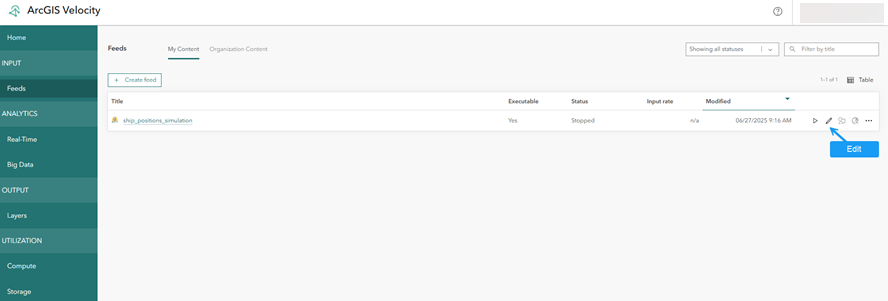
- Editing the symbology of the output features

- Opening a feed in Map Viewer
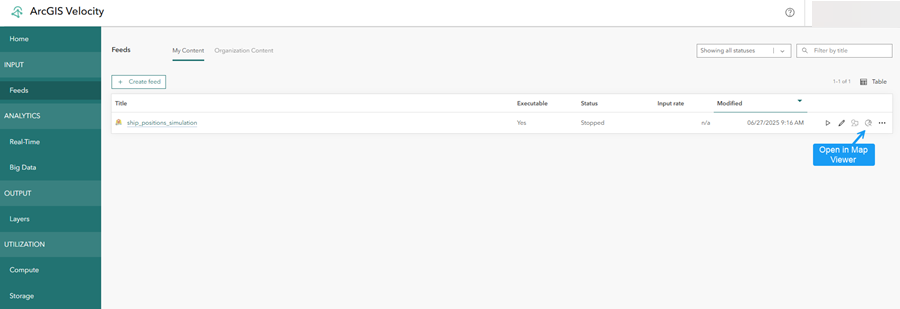
- Accessing additional actions including viewing item details, cloning (copying), deleting, viewing logs, and sharing a feed

- Sorting the feed list by title, executable status, running status, input rate, and modified date
The Feeds page displays an updated list of your configured feeds with their status and key details.
Explore and create analytics
Once you have created a feed, you can explore and create real-time and big data analytics by completing the following steps:
- From the main menu, click the Real-Time tab and explore the Real-Time Analytics page.
The Real-Time Analytics page displays the list and status of your real-time analytics. A real-time analytic performs processing on data being collected through a feed type and analyzes each individual event record as it is received. Real-time analytics are typically used for transforming data, geofencing, and incident detection.

- Click Create real-time analytic.
The options to choose an existing feed or create a new one appear.
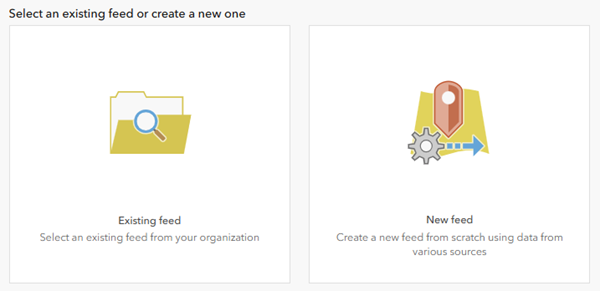
- Click Existing feed to choose an existing feed from your organization.
- On the Select existing feed dialog box, click the My Content drop-down arrow and choose My Organization.

- Choose an existing feed from your organization.
- Click Confirm to choose an existing feed.
The real-time analytic editor opens. You can add more feeds, sources, analytic tools, and outputs to configure a step-by-step real-time processing workflow.
- Click Cancel and then click OK to close the real-time analytic editor, not save the analytic, and return to the Real-Time Analytics page.
- From the main menu, click Big Data and explore the Big Data Analytics page.

The Big Data Analytics page displays the list with information about big data analytics. A big data analytic performs batch processing and analysis on stored data such as data in a feature layer or in cloud big data stores such as Amazon S3 and Azure Blob Store. Big data analytics are typically used for summarizing observations, performing pattern analysis, and enriching data. For more information on creating big data analytics, refer to the designing a big data analytic quick lesson.
- Familiarize yourself with the options for working with existing big data analytics including the following:
- Sorting the analytics by title, executable status, running status, and modified date.
Note:
When creating a title for a big data analytic, you can use underscores and parentheses. International characters are also supported.
- Clicking the start or stop icons to start or stop an analytic. A big data analytic runs until the analysis is complete; then it stops automatically. When a real-time analytic is started, it continues to run until you stop it.
- Clicking the edit button to edit an analytic.
- Clicking the ellipsis button to access additional actions including viewing item details, cloning (copying) the analytic, deleting the analytic, viewing analytic logs, and sharing the analytic.
- Sorting the analytics by title, executable status, running status, and modified date.
You explored the existing real-time and big-data analytics and learned how to create them. The real-time and big data analytics are displayed on the Real-Time and Big Data Analytics pages, respectively.
Explore layers and results
Once you have created Real-Time and Big Data analytics, complete the following steps to explore the output layers associated with your analytics and results:
- From the main menu, click the Layers tab and explore the Layers page.
The Layers page displays a list of output layers such as feature layers, stream layers, and map image layers.

Layers are created when creating output types in big-data analytics. When the analytic runs, the output layers are automatically created. You can manage the layers and open them in a map viewer to view the features in map.
- Familiarize yourself with the options for working with existing layers including the following:
- Clicking the edit button to edit a map image layer. You can adjust the default rendering of the dynamic aggregation. For working with map image layers, refer to visualizing map image layers.
- Clicking the Open in Map Viewer button to add a layer to a web map.
- Clicking the options button to access additional actions including viewing the item details page, opening the layer in the REST Services Directory, deleting the layer, and sharing the layer.
- Sorting the list by title, type, associated dataset, and modified date.
- Every feature layer has an associated map image layer, both of which are based on the same underlying data. Deleting a feature layer also deletes the associated map image layer and the underlying data.
- Stream layers visualize real-time data only; there is no dataset.
Next steps
In this lesson, you explored the Velocity app and worked with feeds, real-time and big data analytics, and output layers.
To expand upon this knowledge, work through the other Velocity quick lessons including creating a feed,designing a big data analytic, and designing a real-time analytic.