Big data analytics perform batch analysis and processing on stored data such as data in a feature layer or cloud big data stores such as Amazon S3 and Azure Blob Store. Big data analytics are typically used for summarizing observations, performing pattern analysis, and enriching data. The analysis that can be performed uses tools from the following tool categories in Velocity:
- Analyze Patterns
- Data Enrichment
- Find Locations
- Manage Data
- Summarize Data
- Use Proximity
Examples
- As an environmental scientist, you can identify times and locations of high ozone levels across the country in a dataset of millions of static sensor records.
- As a retail analyst, you can process millions of anonymous cell phone locations within a designated time range to determine the number of potential consumers within a certain distance of store locations.
- As a GIS analyst, you can run a recurring big data analytic that checks a data source for new features every five minutes and sends a notification if certain attribute or spatial conditions are met.
Components of a big data analytic
There are three components of a big data analytic:
- Sources
- A data source is used to load static or near real-time data in a big data analytic. There are many data source types available. For more information about sources and available source types, see What is a data source?
- There can be multiple data sources in an analytic.
- Tools
- Tools process or analyze data that is loaded from sources.
- There can be multiple tools in a big data analytic.
- Tools can be connected to each other where the output of one tool represents the input of the next tool.
- Outputs
- An output defines what should be done with the results of the big data analytic processing.
- There are many output options available including storing features to a new or existing feature layer, writing features to a cloud layer in Amazon S3 or an Azure Blob Storage, and more. For more information, see Introduction to outputs and Fundamentals of analytic outputs.
- The result of a tool or source can be sent to multiple outputs.
Work with outputs
When a real-time or big data analytic is run, it will generate one or more outputs. Depending on the type of outputs configured, there are several ways you can access and interact with those outputs in ArcGIS Velocity.
ArcGIS feature layer and stream layer outputs
When a real-time or big data analytic creates a feature layer or stream layer output, you can interact with those output layers in Velocity. Note that these methods are not available if the analytic has not yet run.
Access feature layer and stream layer outputs in the analytic
When editing an analytic that has run and successfully created output layers, right-click a feature or stream layer node in the analytic editor to view available options including accessing the node's properties, changing the node label, viewing the item details, opening the layer in a map viewer or scene viewer, sampling the node data, removing the node, and more.
Access feature layer and stream layer outputs from the Layers page
All feature layers, map image layers, and stream layers created by real-time and big data analytics will appear on the Layers page in Velocity. From here, you can edit existing layers, view these layers in a map viewer, access and view the item details, open the layer in the REST Services Directory, as well as delete and share the layers.
Amazon S3 and Azure Blob Store outputs
Big data analytics are capable of writing output features to Amazon S3 or Azure Blob Store cloud storage. Once the big data analytic finishes, the data will be available in the respective cloud location. If you do not see the output as expected, check the analytic logs from the Logs tab.
All other outputs
Other output types for big data analytics include Email and Kafka. With these outputs, Velocity establishes a connection with the chosen output and sends the event data to the output accordingly.
Run a big data analytic (schedule)
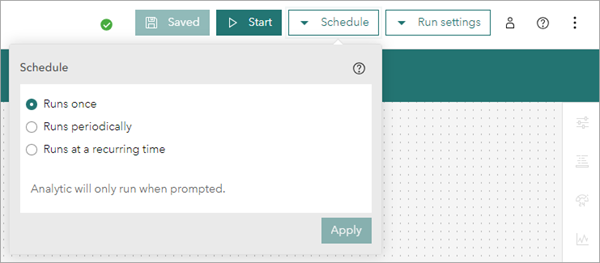
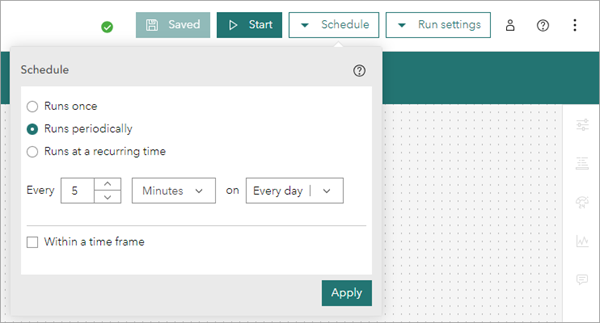
Big data analytics can be configured to run in one of two ways, they can be run once or they can be scheduled to run. When making changes to the run settings, remember to click Apply to save the changes to the big data analytic.
Runs once
Big data analytics configured to run once only run when you start the big data analytic. The analytic performs the processing and analysis as defined and reverts to a stopped state once complete. This differs from feeds, real-time analytics, and scheduled big data analytics, which all continue to run once started. Runs once is the default option for big data analytics.

Scheduled
A big data analytic can be scheduled to run periodically (for example, every five minutes) or at a recurring time (for example, daily at 4 a.m.).

When a big data analytic is configured to run in a scheduled manner, once the analytic is started, it will remain started unless the analytic is stopped. Unlike a real-time analytic, a scheduled big data analytic that is started will only consume resources while it is performing the analysis. For example, if a big data analytic is scheduled to run periodically every hour, and the analysis takes four minutes to complete, the big data analytic will only consume resources once an hour for the four minutes that it takes to perform the analysis.
For more information on how to schedule big data analytics, see Schedule recurring big data analysis.
Perform near-real-time analysis
Scheduled big data analytics can be used to perform near-real-time analysis in which the big data analytic processes only the latest features added to a feature layer since its last run. For more information, use cases, and options for configuring near-real-time analysis, see Perform near real-time analysis.
Generate up-to-date informational products
Alternatively, scheduled big data analytics can be used to generate up-to-date informational products at a user-defined interval. For more information and examples of use cases and options for such workflows, see Generate up-to-date informational products.
Run settings
With big data analytics, you can adjust the Run settings. These settings control the resource allocation provided by your Velocity deployment to your analytic for processing. Remember to save your analytic after making any changes to run settings.
Generally, the more resources provided to an analytic, the faster it will complete processing and generate results. When working with larger datasets or complex analysis, it is a best practice, and at times essential, to increase the resource allocation available to an analytic.
Conversely, if you have a simple analytic with few features that runs successfully with the Medium (default) setting, consider decreasing the run settings resource allocation to the Small setting. This allows you to run more feeds, real-time analytics, and big data analytics in your Velocity deployment.

Considerations and limitations
There are several considerations to keep in mind when using big data analytics:
- Big data analytics are optimized for working with high volumes of data and summarizing patterns and trends, which typically result in a reduced set of output features or records compared to the number of input features.
- Big data analytics are not optimized for loading or writing massive volumes of features in a single run. Writing tens of millions of features or higher with a big data analytic may result in longer run times.
- As a best practice, it is recommended that you use big data analytics for summarization and analysis as opposed to copying data.
- The Large run setting, available with Standard and Advanced licenses of ArcGIS Velocity, can only be used with a runs once setting.