You can use ArcGIS Velocity to create analytic pipelines that perform real-time or big data analytics on event data. The Velocity app provides options to create, configure, save, and view analytics.
Create an analytic
In the Velocity app, the main menu contains an Analytics section with options to create real-time and big data analytics. Use these options to open the Real-Time Analytics or Big Data Analytics page, where you can create real-time or big data analytic by clicking Create real-time analytic or Create big data analytic.
When creating a real-time analytic, choose an Existing feed or New feed. When creating a big data analytic, click Select a type of data source. Once you choose or create the feed, begin configuring the analytic in the analytic editor. Use the analytic editor to configure tools, outputs, and additional data sources. Analytics can be saved, started, or further edited. Big data analytics can also be scheduled to run on a recurring basis.
Save an analytic
To save an analytic configuration, click Create analytic and provide a name and, optionally, a description.
After creating the analytic, you can continue to configure additional feeds, sources, tools, and outputs. As changes are made, you can save the analytic by clicking Save. Analytics must have at least one input and one output before it can be started.
Note:
When creating a title for a real-time or big data analytic, you can use underscores and parentheses. International characters are also supported.
Analytic options
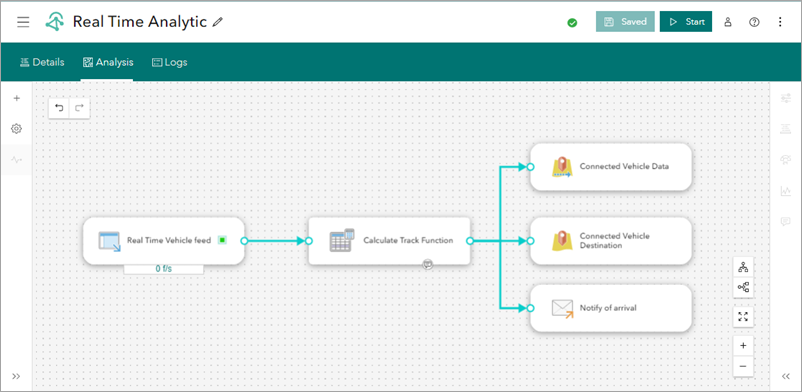
Once an analytic is created and saved, additional options and controls are available. To connect nodes, such as a data source to a tool, a tool to another tool, or a tool to an output, drag the output port of a node to the input port of another node.

Tip:
By default, these connecting lines are animated when the analytic is run, but the animation can be turned off to preserve browser resources by opening the Configuration pane and turning off the Enable route animation toggle button in the Animation section.
The Enable smart layout option in the Layout section allows you to automatically apply horizontal or vertical arrangements as an analysis process is built.
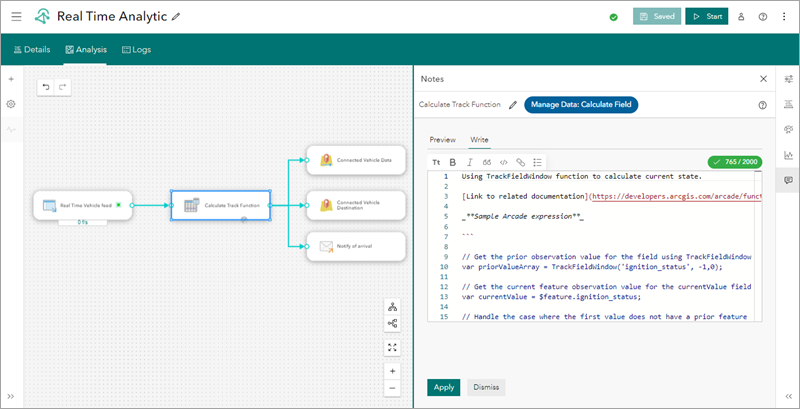
The Notes tool in real-time and big data analytics allows you to add relevant information about a particular node including text, bulleted lists, hyperlinks, and code. To add notes, click the node to activate the Notes tool  . Add your information in the blank space and click Apply to save the new note. A note icon displays on nodes with a note. Adding notes is a useful way to provide important information about nodes and analytic workflows in your organization.

Analytic pipelines
An analytic can have multiple feeds, data sources, tools, and outputs. These elements can be configured in an analytic as a single pipeline or multiple pipelines. A pipeline defines the flow of event data from a feed or data source to any number of tools and outputs.
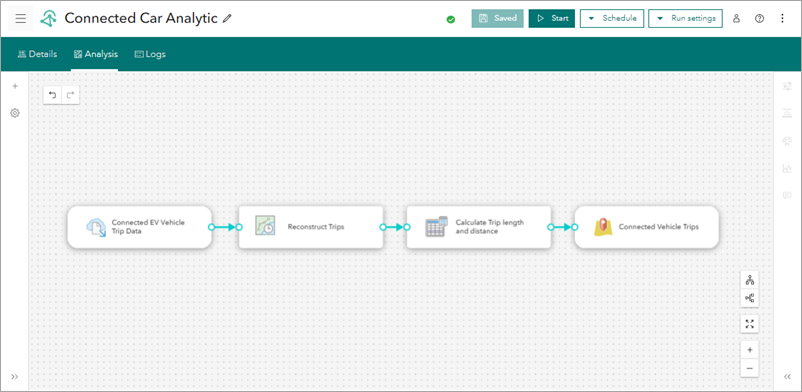
Single-pipeline analytic
A single-pipeline analytic has a single processing path. This path can have one feed and one output or can have many tools in the pipeline, including tools that use additional data sources and one or more outputs.

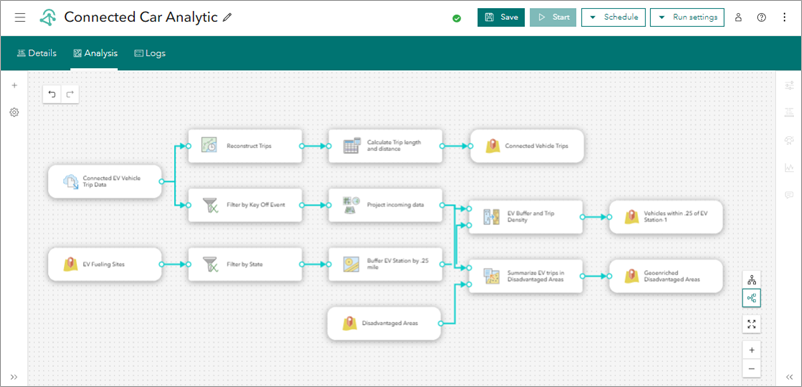
Multiple-pipeline analytic
A multiple-pipeline analytic has more than one processing path for the event data.
