This is an archive related to a previous version of Esri Maps for MicroStrategy. If you need the current version go to http://doc.arcgis.com/en/maps-for-microstrategy/.
Location types
You can easily add data from MicroStrategy directly to a map.
When you add data from MicroStrategy, select the ArcGIS location type that best represents your information. Location information from MicroStrategy is used to create a relationship between your business data and the specified location type.
Default location types
The following default location types are available if your organization is using ArcGIS Online. If you are using Portal for ArcGIS, only the first two location types in the list (Address and Latitude, Longitude) are supported.
- Address—Depending on the geographic region of your organization, address data can be comprised of any of the following: address, neighborhood, city, subregion, region, state, province, postal code, United States Zip Code, country, and so on. The more address elements your data contains, the more accurate your results will be. The address elements can be in separate fields or they can be contained in one field (single-line address). Both methods of finding addresses are supported, but the best results are obtained by using all address elements and storing them in separate fields.
- Latitude, Longitude—Latitude and Longitude values represent an X, Y coordinate location on the map. You can map X,Y coordinate data from any coordinate system. You can choose between World Geodetic Survery 1984 (WGS84) or Web Mercator, or you can specify the well-known ID of any other coordinate system. If you prefer to use WGS84 or Web Mercator, follow these guidelines: if your latitude (Y) values fall between -90 and 90 and the longitude (X) values range from -180 to 180, use WGS84; if your latitude and longitude values are in meters and have 6, 7, or 8 digits before (to the left of) the decimal point, use Web Mercator.
- Standard administrative boundaries (only available with ArcGIS Online)—Standard administrative boundaries include cities, states, provinces, United States Zip Codes, postal codes, and countries. The administrative boundaries available to you are determined by your locale. Cities are added to the map as points. States, provinces, postal codes, United States Zip Codes, and countries are added to the map as polygons, which represent both the shape and the location of the place.
Custom location types
If none of the default location types represent your data, you can specify a dynamic map service or a feature service from ArcGIS to use as a location type. For example, if your organization has its own boundaries (water districts, sales districts, or zoning boundaries), you can map your data using those locations instead of the default location types as long as there is a one-to-one relationship between the rows in your business data and the shapes in the service used as a location type (see Choose a location type for more information). Esri Maps for MicroStrategy supports feature services and map services. For more information on adding a location type based on a dynamic map service or feature service, see Add a location type.
Choose a location type
When you use Esri Maps for MicroStrategy to plot your business data on the map, it is important to choose the correct location type. Before a row of input data can be drawn, it must be located and identified as having either a point, line, or polygon shape. The location type you choose facilitates this process.
Address and Latitude, Longitude
When you choose the Address location type, points are generated using one of the geocoders your organization's administrator configured on ArcGIS Online or Portal for ArcGIS.
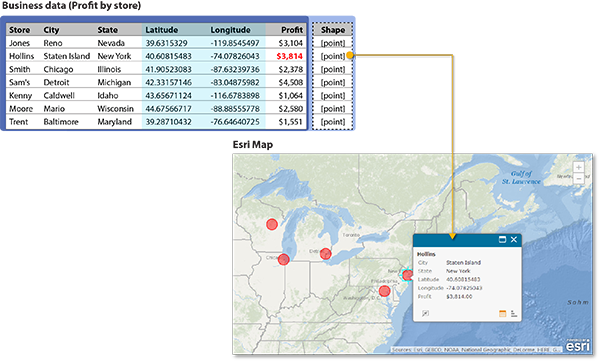
For the Latitude, Longitude location type, data from the identified X and Y location columns is used to generate points.

Standard administrative boundaries and custom types
When you choose any standard administrative boundary or custom location types, the appropriate shapes are located and retrieved using the specified column or columns for the chosen location type. This is done by associating the rows of data with the location type through a common column, known as a key.
The name of the column in your data does not have to match the column name in the location type; however, the information in the column has to be the same in order to produce a match. When a row of data cannot be located—that is, the shape cannot be retrieved from the location type—it is assigned a null shape and is not drawn on the map. The following table shows the supported keys for each location type.
| Location type | Shape type | Supported keys |
|---|---|---|
US State | Polygon | The following is required:
|
US City | Point | The following are required:
|
US ZIP Code | Polygon | One of the following is required:
|
US County | Polygon | The following are required:
|
World City | Point | The following is required:
Optionally, the following may be specified:
|
Country | Polygon | The following is required:
|
Custom | Point, Line, or Polygon (determined by selected map or feature service layer) | Specified during Add a location type workflow |
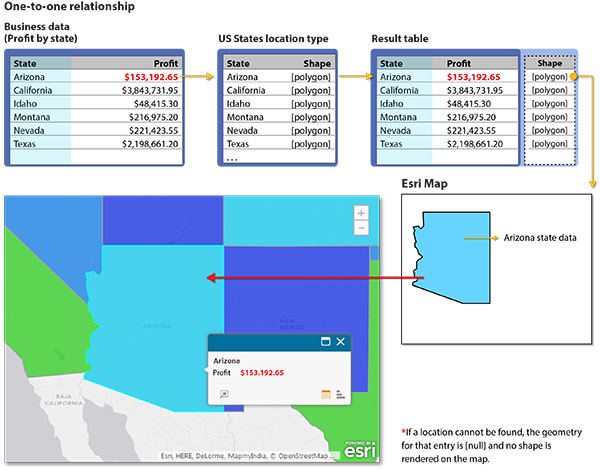
When locating data using standard administrative boundaries or a custom location type, it is important to ensure that that there is a one-to-one relationship between the rows of input data and the shapes in the chosen location type. In a one-to-one relationship, each row of input data corresponds to a single shape on the map. In the following example, each row of input data (Profit by state) corresponds to one US state; the State column represents the unique key. The shape for each row of input data can therefore be easily determined and drawn on the map. In this example, a single polygon shape corresponding to each row in the Profit by state input data (for example, Arizona) is drawn.

Choosing an inappropriate location type can cause unexpected results. This is because the wrong location type often leads to a many-to-one or a one-to-many relationship between the input data and the shapes in the chosen location type. Again, it is important to establish a one-to-one relationship as shown above.
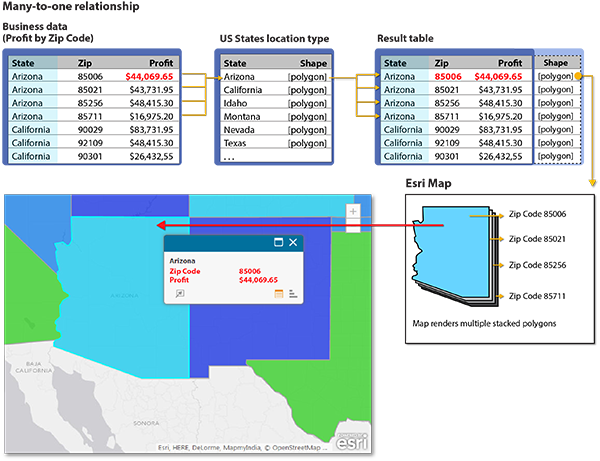
In the following example, the input data shows profit by ZIP Code. The data also contains US state information. Here, ZIP Codes represent the unique key in the input data. Many ZIP Codes are found in any given US state. If the US State location type is chosen—that is, if State is treated as the unique key—each input row will be located to its associated state, creating a many-to-one relationship between the rows of input data and the shapes in the location type. This means that polygon shapes corresponding to the many input rows will be drawn directly on top of one another on a map. In this example, Arizona will be drawn four times. The US ZIP Code location type, and not the US State location type, would therefore be the appropriate choice in this case.

Like the many-to-one relationship, a one-to-many relationship should be avoided. In the case of a one-to-many relationship, only the first matching shape is retrieved and drawn on the map. This would not be an appropriate representation of the input data on a map.