Note:
You need the following account and license types to use this workflow:
- Microsoft license—You need a Microsoft 365 license, with the Contributor role or higher, to format map properties.
- ArcGIS account type—Standard users can perform all the functions of this workflow; you do not need to sign in.
You can use the formatting options in ArcGIS for Power BI to manage the appearance of the map and specify the way others can interact with it.
See Maps to learn about maps and layers.
Customize the map visualization format
To customize map visualization options in ArcGIS for Power BI, complete the following steps:
- Click the ArcGIS for Power BI visualization to select it.
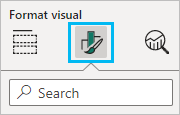
- In the Visualizations pane, click the Format visual tab to display the formatting options.

Note:
For each category, click Reset to default to discard your changes and return to the default settings.Set the Layers list options
The Layers list displays the layers that compose the map.
To set the Layers list options, complete the following steps:
- In the Format visual pane, expand the Layers category.
- To change the name of the list, type a new name in the Title text box.
- To hide the list, turn off the Show Layers toggle button.
The Layers button is removed from the map tools.
- To pin the list in place over the map, turn on the Anchor toggle button.
The list appears in a fixed position over the map. Click the arrow at the bottom of the pane to expand or collapse the list.
- From the Layers position drop-down menu, choose Right or Left to display the list to the right or left of the map.
When you anchor the list, it is pinned to the map and the Layers button no longer appears in the map tools.
If you turn off both Show layers and Anchor, Viewers of the map cannot access the Layers list.
Set the Map tools options
The Map tools formatting options allow you to enable the Zoom in and Zoom out buttons on the map, enable the Basemap tool for viewers, lock the extent of the map, and specify the position of infographics cards.
To set the Map tools options, complete the following steps:
- In the Format visual pane, expand the Map tools category.
- To display the Zoom in and Zoom out tools, turn on the Zoom tools toggle button.
The Zoom in and Zoom out tools appear on the map. These tools are turned off by default. When hidden, viewers can use the mouse and keyboard commands to navigate the map.
Note:
Turning on the Zoom tools toggle button also turns on automatic zoom. For more information, see Lock the map extent.
- To display the Basemap tool, turn on the Basemaps toggle button.
The Basemap tool appears in the map tools on the map. This tool is turned off by default.
Note:
When the Basemap tool is off and you drag data into a Power BI field well, the Basemap tool is automatically turned on. Clearing the field well or clicking Reset to default removes the Basemap tool from the map tools.
- To lock the map so viewers see the map extent as you designed it, turn on the Lock extent toggle button.
Turning on the Lock extent toggle button turns off automatic zoom. For more information, see Lock the map extent.
- To specify the position of infographics cards on the map, choose Right or Left from the Infographics position drop-down menu.
Set the Location type options
Specifying the country in which the data is located helps improve the accuracy of locations on the map. This setting applies only to layers created using Power BI data.
To set the Location type options, complete the following steps:
- In the Format visual pane, expand the Location type category.
- From the Country drop-down menu, choose the country where the data is located. If the data is located in multiple countries, choose World.
Note:
If you change the Format visual pane settings before you add location data to the visualization—for example, if you change the Location type default value (World) to a single country before you add data to the map—the changes may not immediately persist in the pane. Changes will be updated when you drag a location or latitude or longitude values into the appropriate field wells.
Set the Search options
The Search tool allows Viewers to search for an address or place and pin its location on the map. Pinned locations apply to a single session and are not saved with the report. The Search tool is on by default.
To set the Search options, complete the following steps:
- In the Format visual pane, expand the Search category.
- To hide the Search tool, turn off the Search toggle button.
The Search tool is available by default. If you hide it, viewers do not see the Search button
 in the map tools on the map.