Fuzzy logic can be used as an overlay analysis technique to solve traditional overlay analysis applications such as site selection and suitability models.
The basic premise behind fuzzy logic is that there are inaccuracies in attribute and in the geometry of spatial data. Fuzzy logic provides techniques to address both types of inaccuracies, but fuzzy logic, as it pertains to overlay analysis, focuses on inaccuracies in attribute data. The two main areas where inaccuracies arise in attribute data occur in the definition of the classes and in the measurement of the phenomenon. Both of these sources of inaccuracies, especially in the definition of the classes, can cause imprecision in assigning cells to specific classes.
The definition of the classes in a classification and the imprecision in assigning phenomena to classes can affect decision making. The Fuzzy Overlay tools help the decision maker make decisions regarding these imprecisions. Fuzzy logic focuses on modeling the inaccuracies of class boundaries.
The Weighted Overlay and Weighted Sum tools are based on crisp sets, where each cell is either in a class or not. Fuzzy logic specifically addresses situations when the boundaries between classes are not clear. Unlike crisp sets, fuzzy logic is not a matter of in or out of the class; it defines how likely it is that the phenomenon is a member of a set (or class). Fuzzy logic is based on set theory; therefore, you define possibilities, not probabilities.
For example, in a housing suitability model, if slope is one of the input criteria, each slope value will be transformed or assigned a value between 0 and 1 on the possibility of that slope value being a member of the suitability set for building (or class)—of being suitable. The value 1 indicates full certainty that the value is in the set, and 0 indicates with full certainty that it is not in the set. All other values are some level of possibility, with the higher values indicating more likelihood of membership. The process of transforming the original input values to the 0 to 1 scale of possibility of membership is called the fuzzification process. Each criterion for the model, for example, aspect, distance to roads, and land-use type, will be fuzzified. The Fuzzy Membership tool is used to transform the data to the 0 to 1 possibility scale.
To determine the locations that best meet all criteria—that is, have high likelihood of membership in all sets—the Fuzzy Overlay tool is used. When combining multiple criteria, the Fuzzy Overlay tool explores the likelihood of the cell being a member of each set defined by the multiple criteria. For example, what is the likelihood that a particular location belongs to the favorable suitability for slope, aspect, and distance to roads?
Therefore, the two main steps in fuzzy logic for overlay analysis are the fuzzification, or the fuzzy membership process, and fuzzy overlay analysis. These two steps correlate to the reclassify/transform and the add/combine steps, respectively, in the general overlay process.
Whether something belongs to a class or not many times is not clear-cut but is subjective. In human language, these imprecisions are qualified through modifiers, such as very, slightly, and moderately. Fuzzy logic performs overlay analysis more like natural human thinking. Things are not clear-cut; boundaries can be fuzzy. Fuzzy logic is not analysis of the uncertainty in data, but instead explores the imprecision in class boundaries.
The following sections will discuss the issues with data classification, the fuzzy membership process, and performing fuzzy overlay analysis. Also discussed below is a comparison of fuzzy logic to binary and weighted overlay analysis techniques and how fuzzy logic integrates into the general overlay process.
Data classification and fuzzy logic
To describe or order phenomena, you would generally characterize them into classes. Land-use category, soil type, suitability weighting, road class, and vegetation type are all examples of classes. In crisp sets, the membership is binary, and the phenomenon is either in or not within the class. The class boundaries are sharp. But due to imprecision of thought, ambiguous categorization rules, vagueness, and ambivalence, the boundaries between classes are not always clear.
For example, if the phenomenon you are exploring is the relationship of the different heights of people within a group, you may start by clustering the different people into classes based on their height. You may start with three classes—short, medium, and tall. You have to set the boundaries for the classes. For example, a short person may be anyone 5 feet (1.524 meters) or under, a tall person may be 6 feet (1.8288 meters) and over, and a person of medium height is between 5 and 6 feet (1.6764 and 1.8288 meters). If a person is 6 feet (1.8288 meters) tall, they will be placed in the tall class. If a person is 5' 11" (1.8034 meters), they will be classified as medium. With a difference of only 1 inch (0.0254 meters) between the two people's height, they are placed in two separate classes. This same difference relationship would be depicted if another group member is 5' 1" (1.5494 meters) and the second is 6' 6" (1.9812 meters). Due to the coarseness of the classifications, the full relationships between the heights cannot be captured.
To more appropriately depict the height relationships between the different people, more classes can be added. For example, two more classes could be added—short will be 4' 10" (1.4732 meters) or less, medium short will be 4' 10" (1.4732 meters) to 5' 4" (1.6256 meters), medium height will be 5' 4" (1.6256 meters) to 5' 10" (1.778 meters), medium tall will be 5' 10" (1.778 meters) to 6' 4" (1.9304 meters), and tall will be greater than 6' 4" (1.9304 meters). With this refinement in the classes, the relationship between people's height can be more accurately captured.
Even more classes can be added for further refinement. No matter how many classes are added, there is still a generalization of the height relationship between the people. There are some phenomena that cannot be classified into strictly defined classes. Sometimes it is difficult to group the real world into discrete classes.
As can be seen, defining class boundaries can be subjective and can change with the definition of the phenomenon. In the defined height classes above, it is assumed the people were adults, most likely a mixture of men and women. The class definitions may have to change if the group is entirely composed of women. The class boundaries may have to change even further if the group is composed of or includes children.
The definition of classes and the characteristics of the phenomenon dictate how to represent the phenomenon being modeled. Measurement error further compounds the problem of classifications. If the procedure for measuring the people's height has an accuracy of plus or minus 1 inch (0.0254 meter), the inaccuracy can change the class to which a phenomenon is assigned.
Fuzzy logic models this imprecision in the classification process. In fuzzy logic, the classes are defined as sets. There is an understanding of what the ideal value is for membership in the set, for example, the ideal slope value in a housing suitability model. As the values move away from the ideal, the level of clarity diminishes to a certain point where it is clear the value is not a member of the set (for example, it is definitely too steep to build on).
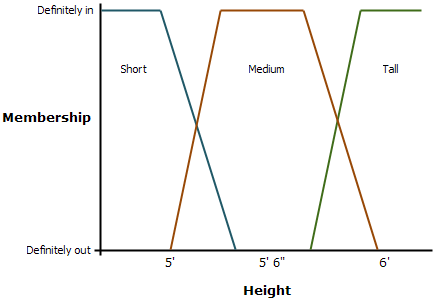
For example, in the height application above, if you stay with your three height classes—short, medium, and tall—the three classes in fuzzy logic can overlap.

In the above image, full membership into each class is
- Short: < 5 feet (1.524 meters)
- Medium: 5' 3 1/2" (1.6129 meters) to 5' 8 1/2" (1.7399 meters)
- Tall: > 6 (1.8288 meters)
For the short set (or class), anyone 5 feet (1.524 meters) or below is definitely within the small set and is assigned a 1. Any height greater than 5 feet (1.524 meters) and less than 5' 3 1/2" (1.6129 meters) is between the small and medium sets (or classes). For heights between 5 feet (1.524 meters) and 5' 1 3/4" (1.6193 meters), the heights are more likely to be in the short set. Heights greater than 5' 1 3/4" (1.6193 meters) and less than or equal to 5' 3 1/2" (1.6129 meters) are possibly in the short set but have a greater possibility of being part of the medium set.
The fuzzification process is implemented generally through predetermined functions using the Fuzzy Membership tool.
Fuzzy membership
The fuzzification process characterizes the imprecision of classes for phenomena that do not have sharply defined boundaries.
Fuzzification converts the original values of the phenomenon to the possibility that they belong to a defined set. The defined set can consist of being suitable or within a favorable distance or having the possibility of finding a specified mineral. The original values of the phenomenon are reclassified on this membership continuum through predefined fuzzy membership functions or through any other reclassification techniques.
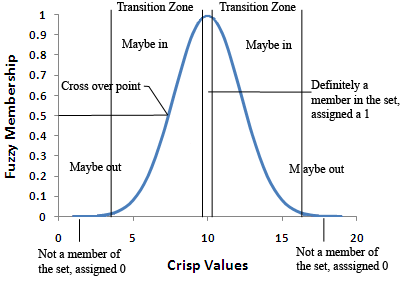
In the fuzzification process, the ideal definition for membership to the set is defined. Each value of the phenomenon more central to the core of the definition of the set will be assigned as 1. Those values that are definitely not part of the set are assigned a 0. Those values that fall between the two extremes fall in the transitional zone of the set, the boundary. As the values move away from the ideal or the center of the set, they are assigned a decreasing value on a continuous scale from 1 to 0. As the assigned values decrease, the original phenomenon value has less possibility of being a member of that set.
The fuzzification value of 0.5 is the crossover point. Any fuzzy value greater than 0.5 implies that the original phenomenon value may be a member of the set. As the fuzzification values go below 0.5, it is less likely that the original phenomenon's value is a member of the set; the values may not be part of the set.

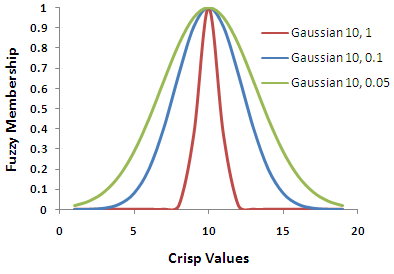
The width of the transition zone depends on the phenomenon being modeled, what is known about the phenomenon, the definition of the set, and the accuracy of the measurement. Changing the parameters of the fuzzification function can define the characteristics of the transition zone. In the image below, the fuzzy Gaussian function is shown with three different curves derived from changing the parameters of the function.

The parameters serve as modifiers for defining the set. The modifiers characterize the potential overlap or middle ground between sets.
The fuzzification process happens for each criterion in the overlay analysis.
Fuzzy overlay techniques
To analyze the relationships and interaction between all the sets for the multiple criteria in the overlay model, fuzzy overlay techniques are used. Since the fuzzification process is based on the degree of membership to a set, the overlay techniques describe the interaction of the inaccuracies in the membership of the sets. The fuzzy overlay techniques are based on set theory. Set theory is the mathematical discipline quantifying the membership relationship of phenomenon to specific sets. In fuzzy overlay, generally a set corresponds to a class.
The available fuzzy set overlay techniques are fuzzy And, fuzzy Or, fuzzy Product, fuzzy Sum, and fuzzy Gamma. Each of these techniques describes the cell's membership relationship to the input sets. For example, the fuzzy And overlay type creates an output raster where each cell value is given the minimum assigned fuzzy value for each of the sets the cell location belongs to. If the overlay analysis is a housing suitability model and each of the multiple criteria has been fuzzified relative to its membership to belonging to suitable sets, fuzzy And identifies the lowest possibility of the cell belonging to one of the suitable sets within the multiple criteria.
The fuzzy Or type returns the maximum value of the intersection of the sets. That is, in the housing suitability model, the highest potential membership (the highest suitability value) for each cell is evaluated for the multiple criteria.
Binary, weighted, and fuzzy logic overlay
In many descriptions of fuzzy logic for overlay analysis, it is generally compared to binary overlay analysis. In binary overlay analysis, for each criterion, each cell is evaluated as to whether it is in a specified class or not. As identified above, in many cases, it can be difficult to define clear class boundaries and definitively assign cells to specific classes. In a binary analysis, for the case of a housing suitability model, each cell is assigned as being suitable (1) or not (0) for each criterion. In the overlay process, the locations that are assigned a 1 for all the input criteria are considered to be potentially suitable locations.
The limitations of the binary overlay analysis approach include:
- If no location meets all criteria, there is no second best option identified.
- There is no relative weighting of the locations that meet the criteria.
- The problems discussed above concerning the classification process.
Weighted overlay analysis attempts to address these limitations. Instead of classifying each cell on a 1 or 0 binary scale, the Weighted Overlay tool assigns each cell value on a defined continuous scale such as a 1 to 10 scale, with 10 being the most preferred relative to the criteria. The continuous scale provides more gradations of classes, allowing more refinement of the representation of the phenomenon. For each criterion, each cell is assigned to the 1 to 10 scale. Each of the reclassified criteria are then added together. The cell locations with the highest summed values are the most preferred relative to the input criteria. The more of the favorable criteria of each of the input the better.
Fuzzy overlay and weighted overlay are more similar to each other than either is to binary overlay; however, the two are built on different foundations. Fuzzy overlay is based on set theory, while weighted overlay is based on linear combinations. Both techniques transform the original values. In fuzzy overlay, the transformation defines the possibility of membership to sets, while weighted overlay is on a relative preference scale. Since these two techniques are unique, the tools for performing analysis between multiple criteria are not interchangeable.
Fuzzy logic and the general overlay analysis process
Fuzzy logic overlay analysis follows the general overlay analysis steps, but with more emphasis on certain steps, less on others, and different meaning of the values of the assigned numbers relative to the other overlay analysis approaches.
The general overlay analysis steps are:
- Define the problem.
- Break the problem into submodels.
- Determine significant layers.
- Reclassify or transform the data within a layer.
- Weight the input layers.
- Add or combine the layers.
- Analyze.
As with all overlay analysis, steps 1 through 3 are the same for fuzzy logic analysis. Since fuzzy logic is based on sets, the meaning of the reclassified values (step 4) and the analysis techniques that can be used to combine the multiple criteria (step 6) make fuzzy logic unique relative to other overlay analysis approaches.
The following sections discuss how fuzzy logic differs in steps 4 through 7.
Reclassify or transform the data within a layer
The input data is reclassified or transformed on a 0 to 1 scale, identifying the possibility of belonging to a specified set. This reclassification or fuzzification process is implemented through the Fuzzy Membership tool. A series of membership functions have been developed to aid in this transformation process. The available functions are fuzzy Gaussian, fuzzy Large, fuzzy Linear, fuzzy MSLarge, fuzzy MSSmall, fuzzy Near, and fuzzy Small. Each membership function transforms the data in a specific way to capture the interaction of the phenomenon.
Weight the input layers
Because fuzzy logic is based on set theory and you are determining whether a particular location belongs to one or multiple sets, weighting does not make sense. Increasing the weight of one factor over another cannot increase the possibility of belonging to one set or a combination of multiple sets. The location is either a member of a set or not (along with all degrees in between). In fuzzy overlay analysis, weighting the criteria is not applicable.
Add or combine the layers
In the add or combine step, fuzzy logic explores the interaction of the possibility of the phenomenon belonging to multiple sets, as opposed to weighted overlay and weighted sum, which are based on the idea that more favorable elements means a better result.
For fuzzy overlay, there are specific techniques to investigate this relative relationship and for quantifying the interaction. The combination approaches are fuzzy And, fuzzy Or, fuzzy Product, fuzzy Sum, and fuzzy Gamma. Each of these approaches is based on set theory and is specific to fuzzy overlay analysis.
Analyze
As in any overlay analysis, it is up to you to analyze and interpret the results. However, because of the different meanings of the reclassified values and of the overlay techniques underlying each overlay approach, different mechanisms may need to be employed to measure the validity of the results.