Analysis tools in ArcGIS Urban allow planners to make informed, data-driven, and transparent decisions by quantifying the spatial and regulatory impacts of proposed developments. Evaluating the impact of a site plan or development scenario—such as assessing the suitability of parcels, visualizing sunlight access, or calculating green space ratio during early design stages—is a crucial and fundamental part of urban planning.
Get to know the comprehensive analysis tools that are available in ArcGIS Urban to support data-driven planning and decision-making.
Metrics

Metrics provide a data-driven foundation for evaluating the impact of planning decisions—for example, comparing residential density or drainage capacity of green spaces across different development scenarios.
Note:
Learn more about metrics in Configure the dashboard.
Suitability

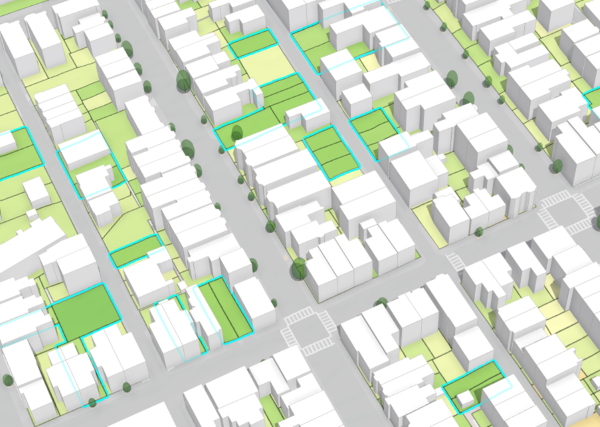
Suitability analysis helps identify optimal parcels for development—for example, highlighting sites with aging building stock and outside flood zones.
In the suitability analysis tool, you can use custom criteria based on parcel or zoning attributes, or data from external layers to define different weights for the suitability score calculation.
Note:
Learn more about suitability analysis in Work with suitability analysis.
Shadow cast

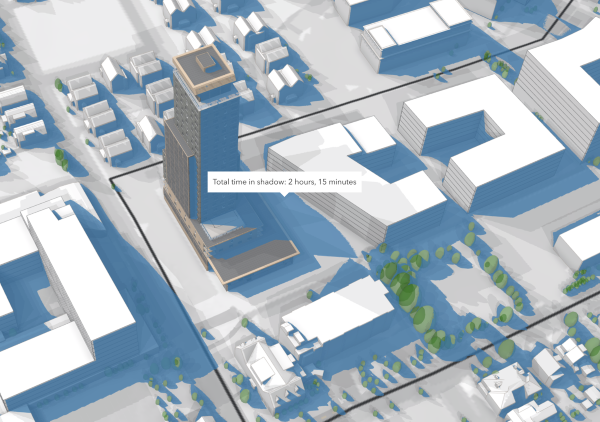
Shadow cast analysis supports informed design by revealing how proposed buildings affect sunlight access—for example, ensuring compliance with daylight regulations or minimizing impact on public spaces.
You can use the shadow cast analysis to view the accumulative shadows in your map at a specific date for a certain time range. Analyze the areas above thresholds to comply with zoning laws, calculate the total shadow duration for a specific area, or review discrete shadow panels of your proposed buildings.
Note:
Learn more about shadow cast analysis in Work with shadow cast.
Viewshed

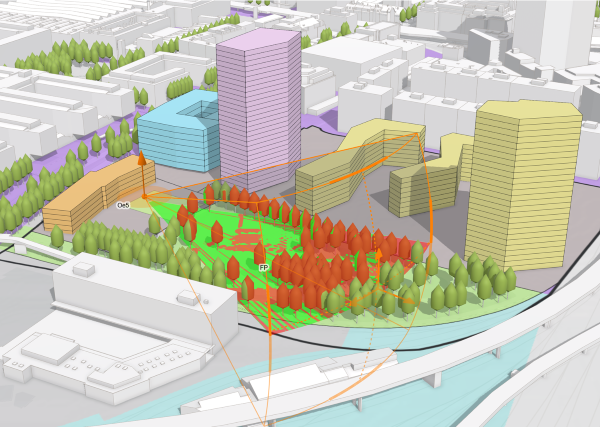
Viewshed analysis enhances spatial planning by identifying which areas are visually connected to key viewpoints—for example, preserving viewing corridors or ensuring landmark visibility from public spaces.
With the viewshed analysis, you can determine visible areas from a specified observer location. This analysis considers factors such as terrain and objects obstructing the scene to calculate the visible extent from the observer point.
Note:
Learn more about viewshed analysis in Work with viewshed analysis.
Line of sight

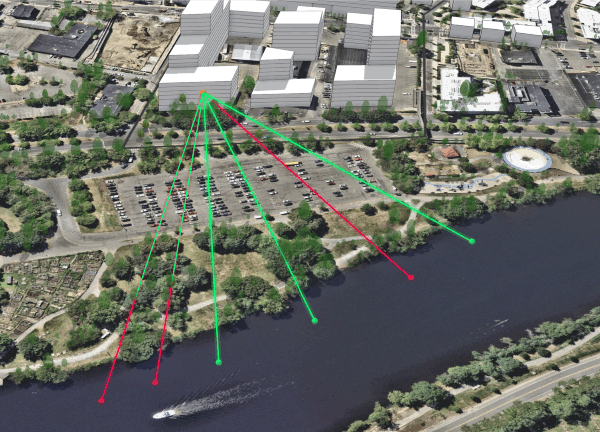
Line of sight analysis allows detailed visibility checks between specific points—for example, verifying unobstructed views from a proposed balcony to a landmark or assessing privacy impacts between buildings.
You can analyze the visibility from one observer point to one or more target points using the line of sight analysis. If nothing is obstructing the view, the line between observer and target point is green. If an object obstructs the line of sight, the nonvisible part appears in red.
Note:
Learn more about line of sight analysis in Work with line of sight analysis.
Elevation profile

The elevation profile enables terrain-aware planning by visualizing elevation changes along a path—for example, creating a cross section through a street to assess slope, curb height, and accessibility for pedestrians or cyclists.
You can draw a line to generate an elevation profile of your scene. An interactive diagram can be used to explore the results of the analysis.
Note:
Learn more about elevation profile analysis in Work with elevation profile.
Indicators

Indicators bring external analysis into the planning context—for example, integrating flood simulation layers to assess climate resilience and guide development away from high-risk zones.
You can add indicators to visualize GIS layers and charts that were created outside of ArcGIS Urban, for example, using ArcGIS Pro or Scene Viewer, to provide additional context for planning and decision-making.
Note:
Learn more about indicators in Work with indicators.
Access analysis tools
You can use analysis tools for various workflows in ArcGIS Urban. To understand where you can use the different tools, consult the following table:
| Analysis tool | Overview | Plans | Projects |
|---|---|---|---|
Metrics* |  |  | |
Suitability |  | ||
Shadow cast** |  |  |  |
Viewshed** |  |  |  |
Line of sight** |  |  |  |
Elevation profile** |  |  |  |
Indicators |  |
* Metrics in projects are different from metrics in plans. See Configure the dashboard to learn about the difference.
** The analysis results in the overview are not persisted.