Note:
You need the following account and license types to use this workflow:
- Microsoft license—You need a Microsoft 365 license and the Contributor role or higher to use this workflow.
- ArcGIS account type—Standard users can perform the basic functions of this workflow; you do not need to sign in.
You can use ArcGIS for Microsoft 365 data types, formats, and categories to improve location data matching results.
See Data and geocoding to learn more about geocoding.
The following sections contain information about setting up data for ArcGIS for Microsoft 365 .
Categorize location fields
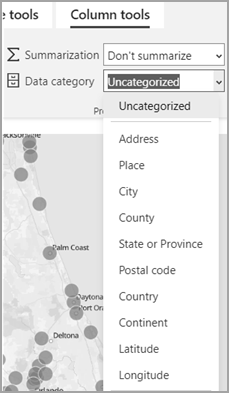
To help ensure that ArcGIS for Power BI accurately geocodes the data, you must specify the data category for each location field.
To categorize location fields, complete the following steps:
- Using the Power BI Desktop Report Editor, choose the column or field to modify.
- On the ribbon, click the Modeling tab.
- On the Column tools tab, choose the appropriate category from the Data category drop-down menu.
For example, choose State or Province to categorize a state in the United States. For a world country, choose Country. For ZIP Codes, choose Postal code. If you created a combined location column, choose Address.

- For columns that contain location data, set the Summarization option to Don't summarize.
Use text values
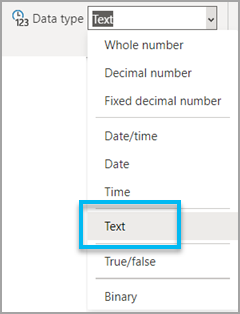
When applicable, format dataset columns that are used for location (ZIP Codes, for example) as text values, not numeric values. If the data contains a number that includes a leading zero, as is common with ZIP Codes, some software packages interpret these numbers as numeric values and remove the leading zero, changing the original value. Formatting such columns as text ensures that the data remains accurate.

Use time formats
ArcGIS for Microsoft 365 supports the date and time formats listed in this section. If you use a format that is not listed, ArcGIS for Microsoft 365 attempts to match it to an equivalent format; for example, 30Dec1997 will display as 30 Dec 1997. If there is no equivalent format, ArcGIS for Microsoft 365 uses the default value: MM/DD/YYYY HH:MM: AM/PM (12/30/1997 6:00 PM).
ArcGIS for Microsoft 365 supports the following date-time formats:
| Date-time format | Example |
|---|---|
MM/DD/YYYY | 12/30/1997 |
Month DD, YYYY | December 30, 1997 |
Day Month (short) YYYY | Tuesday, December 30, 1997 |
| MM/DD/YYYY HH:MM AM/PM | 12/30/1997 6:00 PM |
MM/DD/YYYY HH:MM (24hr) | 12/30/1997 18:00 |
MM/DD/YYYY HH:MM:SS AM/PM | 12/30/1997 5:50:50 PM |
MM/DD/YYYY HH:MM:SS (24hr) | 12/30/1997 17:59:59 |
Month YYYY | December 1997 |
YYYY | 1997 |
HH:MM:SS AM/PM | 5:59:59 |
HH:MM:SS (24hr) | 17:59:59 |
HH:MM AM/PM | 5:59 PM |
HH:MM (24hr) | 17:59 |
For best results, use the Power BI modeling tools to set the date and time formats before you add data to a map.
Number of locations supported
When creating a map, you may want to add a large amount of data to it. Keep in mind that plotting too many individual locations can lead to viewer confusion, and the resulting map may not provide a clear picture of the data. In addition to creating a map that may be difficult to interpret, geocoding a large number of rows of data may negatively impact performance.
Due to hardware and browser limitations, performance may vary when you render polygons, such as ZIP Codes, counties, or block groups. To mitigate problems, ArcGIS for Power BI restricts the maximum number of locations supported.
The following table compares available location data value maximums by ArcGIS account user role and type:
| Location | Standard user | ArcGIS account holder |
|---|---|---|
Address information in the Location field well |
|
|
Latitude and Longitude values in corresponding field wells |
|
|
Standard administrative boundaries in the Location field well |
|
|
EsriJSON in the Location field well |
|
|
An ArcGIS for Power BI visualization can contain a maximum of 1,024 data columns.
For more information about address and location fields, see Data preparation.