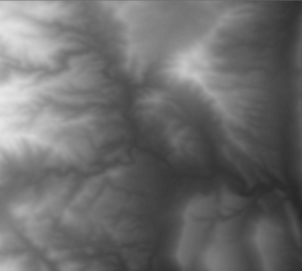
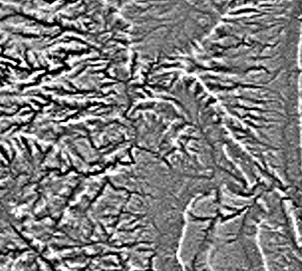
The Curvature function displays the shape or curvature of the slope. A part of a surface can be concave or convex; you can tell that by looking at the curvature value. The curvature is calculated by computing the second derivative of the surface.
The output of the Curvature function can be used to describe the physical characteristics of a drainage basin in an effort to understand erosion and runoff processes. The curvature value can be used to find soil erosion patterns as well as the distribution of water on land. The profile curvature affects the acceleration and deceleration of flow and, therefore, influences erosion and deposition. The planform curvature influences convergence and divergence of flow.


Notes
The units of the curvature output raster are one hundredth (1/100) of a z-unit. The reasonably expected values for a curvature raster for a hilly area (moderate relief) can vary from -0.5 to 0.5; while for steep, rugged mountains (extreme relief), the values can vary between -4 and 4. It is possible to exceed these ranges for certain raster surfaces.
Parameters
| Parameter name | Description |
|---|---|
DEM | A digital elevation model (DEM) raster. |
Curvature Type | The curvature type accentuates different aspects of the slope. There are three curvature options:
|
Z Factor | The z-factor adjusts the units of measure for the z units when they are different from the x,y units of the input surface. If the x,y units and z units are in the same units of measure, the z-factor should be set to 1. The z-values of the input surface are multiplied by the z-factor when calculating the final output surface. For example, if your z units are feet and your x,y units are meters, you would use a z-factor of 0.3048 to convert your z units from feet to meters, since 1 foot = 0.3048 meters. |
Learn more about how curvature works
The curvature type will highlight different aspects of the shape of the slope. The various curvature types help visualize different aspects of the slope.
Profile
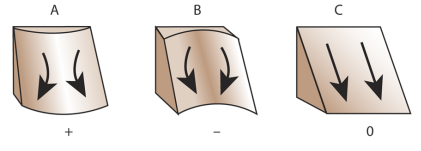
The Profile curvature is parallel to the slope and indicates the direction of maximum slope. It affects the acceleration and deceleration of flow across the surface. A negative value (A) indicates that the surface is upwardly convex at that cell, and flow will be decelerated. A positive profile (B) indicates that the surface is upwardly concave at that cell, and the flow will be accelerated. A value of zero indicates that the surface is linear (C).

Planform
The Planform curvature (commonly called plan curvature) is perpendicular to the direction of the maximum slope. Planform curvature relates to the convergence and divergence of flow across a surface. A positive value (A) indicates that the surface is laterally convex at that cell. A negative plan (B) indicates that the surface is laterally concave at that cell. A value of zero indicates that the surface is linear (C).

Standard
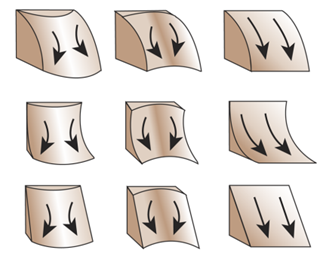
The Standard curvature combines both the profile and planform curvatures. The profile curvature affects the acceleration and deceleration of flow and, therefore, influences erosion and deposition. The planform curvature influences convergence and divergence of flow. Considering both planform and profile curvature together allows you to understand more accurately the flow across a surface.
In the following diagram, the columns show the planform curves, and the rows show the profile curve. The planform columns are positive, negative, and 0—going from left to right. The profiles curves are negative, positive, and 0—going from top to bottom.
