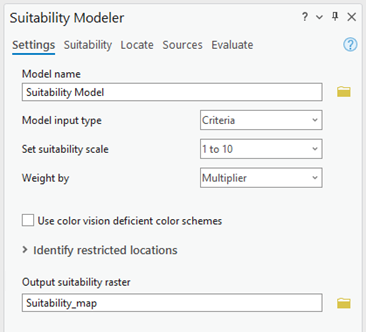
In Suitability Modeler, use the Settings tab to define the settings that will be used in the model. Specify the following:
- The name of the suitability model
- The type of input to the model
- The range of the suitability scale
- The method to weight the inputs relative to one another
- Whether to use color vision deficient color schemes
- The locations that are restricted and should be removed from the analysis
- The name of the output suitability map

Input type
Use the Model input type drop-down list to specify the input to the model, either criteria or submodels. To create a basic suitability model or a series of submodels, choose Criteria. To combine a series of submodels into a composite model, choose Submodels. For additional information, see Work with submodels.
Suitability scale
Use the Set suitability scale drop-down list to select a scale. Options include 0 to 1, 1 to 3, and the default 1 to 10. This setting is not available when Model input type is set to Submodels, since the values are already transformed.
Weight by a multiplier
Weighting by multiplier is best when the criteria can be weighted directly relative to one another. First, the transformed criteria values are multiplied by the specified multiplier. Then the multiplied transformed criteria values are added together. The range of the resulting values in the suitability map depends on the range of the suitability scale, the number of criteria, and the values of the multipliers. For example, if five criteria are entered, the suitability scale is set to 1 to 10, and the multipliers are all 1, the resulting range can be from 5 to 50.
The recommended range of the multipliers in most cases is from 1.0 to 2.0. Use caution when specifying high values beyond this range. For example, if you set a multiplier to 10, it causes that criterion to become 10 times more important than a criterion with a multiplier of 1, an extreme weighting that may produce unexpected results.
Specify the multipliers by increasing the multiplier value in the spinner control or by typing a value. Keep in mind that as more multipliers are applied, it may be difficult to know how each criterion will influence the final suitability map.
The same logic is applied when Model input type is set to Submodels.
Weight by percent
The percent option is best when you want to specifically indicate how much each criterion or submodel will influence the resulting suitability map. For example, a criterion or submodel assigned a weight of 60 percent will influence the final output by that amount, regardless of the percent values applied to the other criteria or submodels. The sum of the percentages for all of the criteria or submodels must equal 100 percent.
For criteria, the combined weighted values are linearly transformed to the suitability scale set on the Settings tab. That is, if the suitability scale is 1 to 10, the output values in the final suitability map will range from 1 to 10.
Color deficient color schemes
By default, Suitability Modeler uses a set of color schemes that are intended for users with unimpaired color vision.
Check the Use color vision deficient color schemes check box to enable color vision deficient (CVD) color schemes for all maps, legends, and charts. The color schemes address Deuteranopia (green-blind vision), Protanopia (red-blind vision), and Tritanopia (blue-blind vision) deficiencies.
Identify restricted locations
You can restrict known features at certain locations from being considered in the suitability analysis. Examples of locations you may want to restrict include water bodies, existing structures, protected areas, and areas within legal buffers. A restricted location is different from cell locations that are assigned NoData. Cell locations are set to NoData when there is insufficient information to assign a value,
Use the Identify restricted locations query builder to define the restricted locations. Once identified, the restricted locations are applied to the model, and those locations are not included in the analysis.
For more information about identifying and removing restricted locations from the model, see Exclude restricted locations.