The suitability analysis workflow identifies sites that meet criteria you define. Criteria includes variables from the data browser, such as population density, household income, or average annual daily traffic. Each variable can be standardized and weighted. You can also add your own data or set up custom data to use different geographic boundaries or custom suitability criteria. As a result of the suitability analysis, each site is scored, and the results are shown in the Results pane and a map layer. The site ranking score is represented as a color-coded symbols on the map.
Example
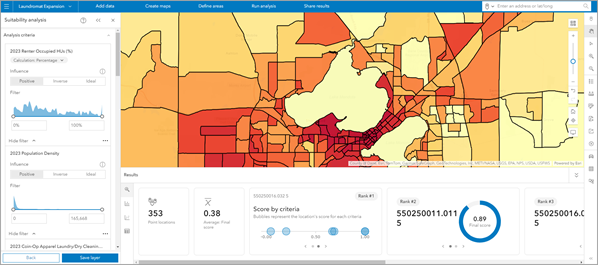
A small business owner of laundry facilities is interested in expanding into new markets. The business owner has analyzed what factors have contributed to a successful facility, such as parking spots, areas with a high percentage of renter-occupied housing, and areas with relatively high population density. The business owner uses these criteria to perform a suitability analysis analyzing block groups in Dane County, Wisconsin. The sites' suitability scores are returned in two places: color-coding of the block groups on the map and in the Results pane.

Note:
This image was created using ArcGIS Business Analyst Web App, where the user experience and workflows are identical to ArcGIS Community Analyst.
To create this example yourself, see the Expand a small business tutorial.
Results
You can view the results of the analysis as a map layer and in the Results pane, which includes a Summary  , Histogram
  , Bubble chart
  , and Table
  . To learn more about the suitability analysis Results pane, see Suitability analysis Results pane. Each site on the map is color-coded to represent its suitability analysis score.
To set preferences, such as turning the intro page on or off, setting color defaults, and adjusting the point layer influence to be positive or negative, see Perform a suitability analysis.
Calculations
The settings that inform each variable's score calculations are found in the Suitability analysis workflow pane. There are three sections on the Suitability analysis workflow pane to modify the calculations: Analysis criteria, Scoring method, and Weighting.
Refine criteria in the Analysis criteria section
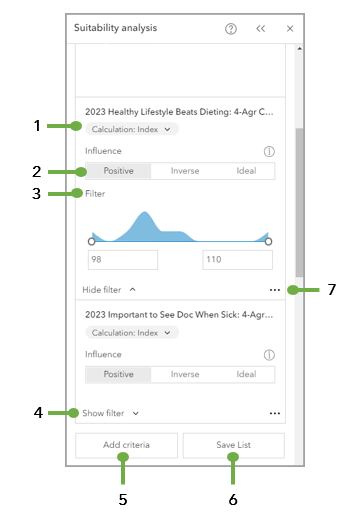
The Analysis criteria section has options to modify the criteria, such as changing the calculation type, the influence, and the minimum and maximum value range.

1 | Calculation type | Use the Calculation drop-down menu to select a calculation type for the variable, if more than one calculation type is available for that variable. Calculation type can be a number, percentage, index value, or average value. |
2 | Influence | This displays the influence of your criteria using the options: positive, inverse, or ideal. By default, the influence for each suitability criterion is set to positive. |
3 | Filter | This displays the threshold for your criteria, which is its range of values. Adjust the slider handles to define the minimum and maximum values included in the analysis or enter values manually. |
4 | Show filter / Hide filter | Click Show filter to expand the Filter slider. To collapse the Filter slider, click Hide filter. |
5 | Add criteria | This option provides a quick way to add suitability criterion to your analysis. Select additional variables by choosing a criteria list, adding variables from the data browser, adding attributing from your sites, or adding a point layer. |
6 | Save list | Click Save list to save the criteria list. |
8 | Options button | Click the Options button |
The influence of your criteria can be modified in the Analysis criteria section of the Suitability analysis workflow pane. The influence can be set to positive, inverse, or ideal, the underlying statistical concepts of criteria influence are described in more detail below.
Positive influence
Positive influence means that the higher the value of the variable, the greater its effect on the final score. This is calculated as the variable value for a site minus the minimum value for that variable, divided by the range of values. This score is then multiplied by the weight assigned to the variable in the analysis. The formula is as follows:
For example, you have added the Total Population variable to a suitability analysis. The population at your site is 332,525 and the range of population at all your sites is 153,957 to 727,103. You've weighted the variable at 25 percent of the total suitability score. The calculation is as follows:

Inverse influence
Inverse influence means that the lower the value of the variable, the greater its effect on the score. This is also referred to as negative influence. This is calculated as the maximum value for a variable minus the variable value for a site, divided by the range of values. This score is then multiplied by the weight assigned to the variable in the analysis. The formula is as follows:
For example, you have added the Total Population variable to a suitability analysis. The population at your site is 332,525 and the range of population at all your sites is 153,957 to 727,103. You've weighted the variable at 25 percent of the total suitability score. The calculation is as follows:
Ideal influence
Ideal influence defines an ideal value for the variable. The closer the value of the variable to the specified ideal, the greater its effect on the score. This is calculated as the ideal value for a variable minus the variable value for a site, divided by the difference between either the ideal and the minimum, or the ideal and the maximum (whichever value is greater). This score is then multiplied by the weight assigned to the variable in the analysis. The formula is as follows:
For example, you have added the Total Population variable to a suitability analysis. You have set the ideal value for the variable as 500,000. The population at your site is 332,525 and the range of population at all your sites is 153,957 to 727,103. You've weighted the variable at 25 percent of the total suitability score. The calculation is as follows:
Customize calculations in the Scoring method section
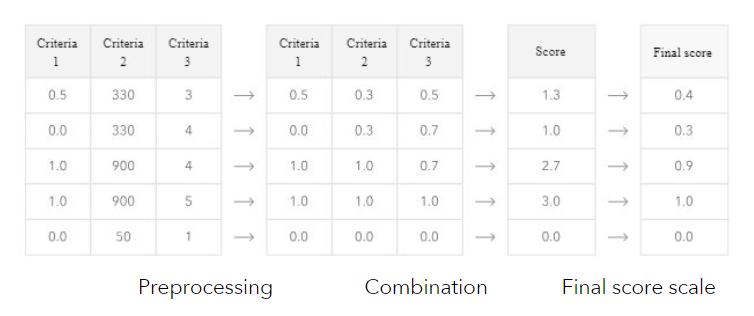
Suitability scores are calculated using methods in a three-part process: preprocessing, combination, and final score scale. Preprocessing standardizes the variables to a common scale. Combination combines the variables into a single value. In ArcGIS Community Analyst, the preprocessing and combination methods are available as common preset processing methods or as custom selections. The final part of suitability analysis calculations is final score scale, which transforms the combined score into meaningful final score values.

Use Preset methods
There are three options in the Preset methods drop-down menu:
- The Combine values (default) option sums the scaled values of the criteria, where each criterion contributes equally to the final score. For preprocessing, it uses the Minimum-maximum method. For combination, it uses the Sum method. This preset method is useful for evaluating the combined effect of all criteria, but it is sensitive to outliers. Extreme values can have a disproportionate impact on the final score.
- The Compound differences option uses the geometric mean of scaled values. For preprocessing, it uses the Minimum-maximum method. For combination, it uses the Geometric mean method. This preset method is useful when criteria are on different units or scales and you want to emphasize the relative differences between values. It is less sensitive to outliers, which is useful when the criteria contains percentages or rates. High value scores only occur when there are high values in multiple criteria. As a result, any extreme value in a single criteria does not disproportionally impact the score.
- The Custom option allows you to select the preprocessing and combination methods, which are described in more detail below.
Use custom selections: Preprocessing method
If you select the Custom option in the Preset methods drop-down menu, select an option from the Preprocessing method drop-down menu. The Preprocessing method options include the following:
- Use the Minimum-maximum (default) option to scale the variables between 0 and 1 using the minimum and maximum values of each variable. In this method, the shape of the distribution is maintained. However, the outliers in the data impact the score.
- Use the Percentile option to convert the variables to percentiles between 0 and 1 by scaling the rank of the data values. This method is useful when you want to ignore the absolute differences between the data values. As a result, the outliers or skewed distributions do not impact the score.
- Use the Z-score option to standardize each criteria by subtracting the mean value and dividing by the standard deviation (or z-score). The z-score is the number of standard deviations above or below the mean value. This method is useful for creating a common scale by normalizing data that use different units. Values above the mean receive positive z-scores, where values below the mean receive negative z-scores.
- Use the Raw values option to use the original values of the variable. No preprocessing is applied, so the data maintains the scale of the input criteria. This method is useful when the criteria are on a comparable scale, such as percentage values or when the criteria has already been preprocessed using other tools.
Use custom selections: Combination method
If you select the Custom option on the Preset methods drop-down menu, select an option from the Combination method drop-down menu. The Combination method options include the following:
- Use the Sum option to use the sum value of the variables.
- Use the Mean option to use the mean (or average) value of the variables.
- Use the Multiply option to use the multiplied value of the variables.
- Use the Geometric mean option to use the geometric mean value of the variables.
Note:
The options Multiply and Geometric mean are not available if the variables are scaled using z-scores since z-scores always contain negative values.Final score scale
Scaling the final score sets the distribution range of the final score values. The Scale final score options include the following:
- Use the 0 to 1 option to calculate a final score with the lowest value of 0 and the highest value of 1. Within the 0 to 1 range, all other values are scaled proportionally.
- Use the 0 to 100 option to calculate a final score with the lowest value of 0 and the highest value of 100. Within the 0 to 100 range, all other values are scaled proportionally.
- Use the None option to leave the data as is, without scaling it. This option is useful when you want to preserve the distribution of the combined values.
Change criteria weights in the Weighting section
The Weighting section lists the criteria and its weight in the analysis. Weights represent the relative importance of each criterion as it contributes to the final score.
The selected criteria are weighted equally by default. You can use decimals to set the weights as a percentage of the total. The weights for all criteria add up to 100 percent. Therefore, if you increase or decrease the weight for any criteria, the weights for each remaining criterion automatically decrease or increase proportionately. The combination method impacts how weights are applied. Using the Sum and Mean combination methods, weights are applied by multiplying criterion by its respective weight. Using the Multiply and Geometric mean combination methods, weights are applied by raising each criterion to the power of its respective weight.
Changing the weight of criteria significantly impacts the results and is a subjective part of the analysis. If you change the weight of criteria, it should be driven by domain knowledge and documented justification.
Limitations
You can select a maximum of 5,000 existing sites. Alternately, you can select up to 1,000 features on the map-for example, features added to the map through points of interest search or by importing a file.
Credits
This workflow consumes credits. Export results to Excel costs an estimate of 10 credits per 1,000 records.
See Credits for full information about credit consumption in ArcGIS Community Analyst.
Resources
To learn more about suitability analysis, see the following resources:
