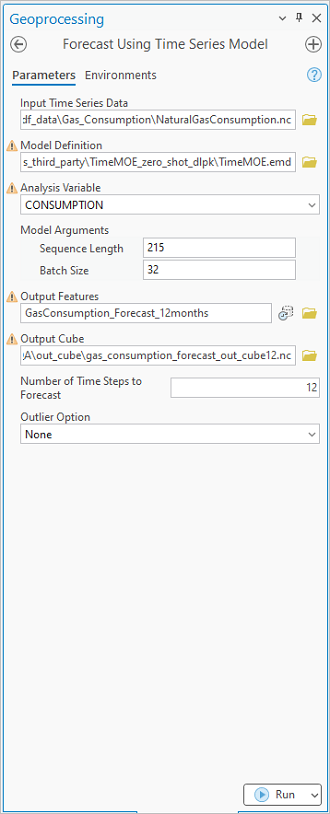
You can use the Time-MoE pretrained model for forecasting on unseen time series data using the Forecast Using Time Series Model tool available in the Time Series AI toolset in ArcGIS Pro. Follow the steps below to use the model for forecasting monthly gas consumption for each of the states in the United States. Fine-tuning this model is currently not supported.
Recommended dataset
Time-MoE is a 2.4-billion-parameter time series foundation model pretrained on the large-scale Time-300B dataset, which spans over nine domains and contains more than 300 billion time points. This model can be used for inferencing directly on multidimensional time series datacube in netCDF format. The Time-MoE pretrained model supports only univariate forecasting and cannot handle multivariate inputs. Follow the steps below to use the model for forecasting monthly gas consumption for each of the states in the United States for 12 months from January 2019 to February 2020. You will be using an input time series datacube in netCDF format of monthly gas consumption from January 2001 to December 2018 , for each of these states to forecast.
The input file should be netCDF data with an .nc file extension and must have been created by the Create Space Time Cube By Aggregating Points, Create Space Time Cube From Defined Locations, Create Space Time Cube From Multidimensional Raster Layer, or Subset Space Time Cube tool. If you have external netCDF data, convert it to the required netCDF data format by using the Create Space Time Cube From Multidimensional Raster Layer tool.
Use the model to forecast gas consumption
Complete the following steps to forecast gas consumption:
- Download the Time-MoE pretrained model.
Any univariate time series input data in the netcdf format can be used.
- Browse to Tools on the Analysis tab.

- Click the Toolboxes tab in the Geoprocessing pane, select GeoAI Tools, and browse to the Forecast Using Time Series Model tool under Time Series AI.

- On the Parameters tab, set the variables as follows:
- For Input Time Series Data, select the NaturalGasConsumption.nc datacube.
- For Model Definition, select the pretrained model .dlpk file.
- For Analysis Variable, select the variable to be forecasted. Use CONSUMPTION since you are forecasting gas consumption.
- Optionally, for Model Arguments, change the values of the arguments if
required
- Sequence Length—The maximum sequence length of historical time steps that is provided as input to the Time-MoE model
for forecasting. This model can take a sequence length of up to 4,096 time steps as the input context. Set it to 215, to include the full input dataset for forecasting.
- Batch Size—The number of training samples that will be processed at one time. The default value is 32. Increasing the batch size can improve tool performance; however, as the batch size increases, more memory is used. If an out of memory error occurs, use a smaller batch size.
- Sequence Length—The maximum sequence length of historical time steps that is provided as input to the Time-MoE model
for forecasting. This model can take a sequence length of up to 4,096 time steps as the input context. Set it to 215, to include the full input dataset for forecasting.
- For Output Features, set the output feature that will contain the forecasted results stored as fields. Each row will contain each location.
- Optionally, for Output Cube, set the output space-time cube (.nc file) to be created. This will contain the values of the input space-time cube with the forecasted time steps appended. Use the Visualize Space Time Cube in 3D tool to see all of the observed and forecasted values simultaneously.
- For Number of Time Steps to Forecast, set the value to 12, since you are forecasting for 12 months. This is a positive integer specifying the number of time steps that will be used to forecast the analysis variable. The default value is 2. This value cannot be larger than 50 percent of the total time steps in the input space-time cube.
- Optionally, for Outlier Option, set it to None. It specifies whether statistically significant time series outliers will be identified.

- Set the variables under the Environments tab as follows:
- For Processor Type, select CPU or GPU as needed.If GPU is available, it is recommended that you select GPU and set GPU ID to specify the GPU to be used.

- For Processor Type, select CPU or GPU as needed.
- Click Run.
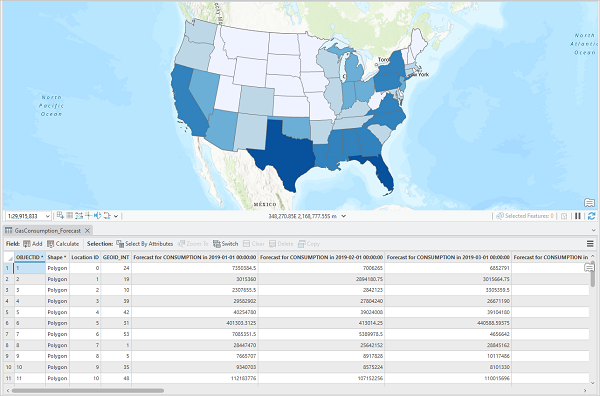
Once processing is complete, the output forecasted feature layer is added to the map. The corresponding attribute table will store all the forecasted values for each location.
