Apply a heat map
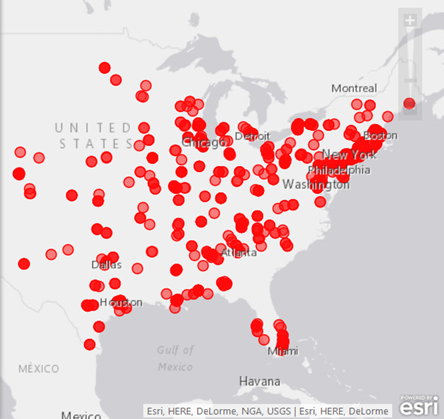
When a layer contains a large number of point features, showing each feature individually on the map is often not useful. In this scenario, point features often overlap, making it difficult to distinguish between features. Even when they do not overlap, it is usually difficult or impossible to visually extract meaningful information when hundreds or thousands of points are shown all at once.

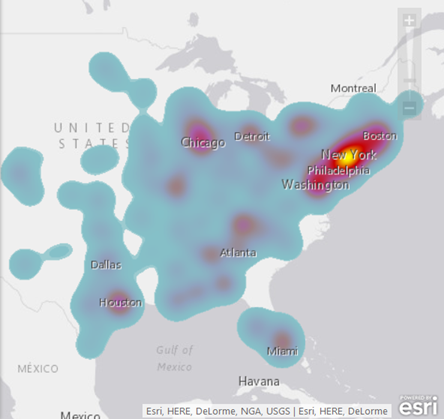
One approach to resolving this issue is to create a heat map. Two types of heat maps can be created:
- Point density heat map—A point density heat map represents the geographic density of point features on a map. It uses the points in the layer to calculate and display the relative density of points as smoothly varying sets of colors ranging from cool (low density of points) to hot (many points).

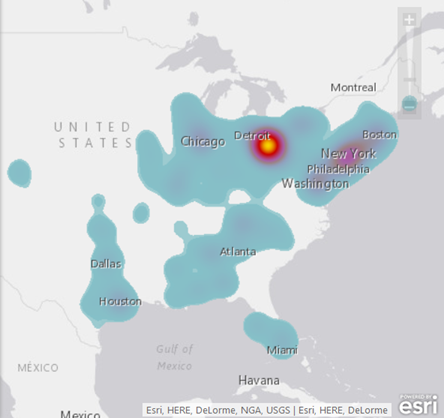
- Weighted measure heat map—A weighted measure heat map is calculated and displayed based on numeric measure values in your data. For example, you can display your stores layer as a heat map that weights store locations by revenue—ranging from cool (low revenue) to hot (high revenue).

It is best to avoid heat maps if you have only a few point features; instead, map the actual points.
Note:
Heat map layers cannot be shared to ArcGIS as a layer, but can be shared as part of a map. In the ArcGIS.com map viewer, the heat map displays as a point layer instead of rendering as a heat map.
- In the Contents pane, press the Configure layer button
 beside the point layer for which you want to configure a heat map.
 - Press the On/Off selector beside Heat map to render your point layer as a heat map.
Note:
The Heat map item will be disabled if Clustering is turned on. You must first turn off clustering before applying and configuring a heat map.
Note:
To remove the heat map and render your layer as points, press the On/Off selector again.
- To change the way the heat map appears on the map, ensure the heat map is enabled and press the Configure heat map button
 .
. - Do any of the following to configure the heat map:
- To configure a weighted measure heat map, press the On/Off selector beside Weight by measure? to enable this type of heat map and specify the measure you want to use in the calculation by choosing the appropriate column from the Choose a column drop-down menu. Only numeric measures can be used; strings and other non-numeric data are not weighted. If you are configuring a point density heat map, set Weight by measure? to Off.
- Choose a color scheme from the Color scheme menu.
- To adjust the intensity of the heat map by making the heat map clusters larger and smoother, or smaller and more distinct, adjust the Area of influence slider.
The map automatically updates to reflect the new heat map settings.
- Press OK when you are finished.
Note:
You can also set the visible range and the transparency of the heat map, if desired.
Note:
You can also set the transparency of the heat map, if desired.
Note:
Changes to your map cannot currently be saved in Esri Maps for MicroStrategy Mobile.