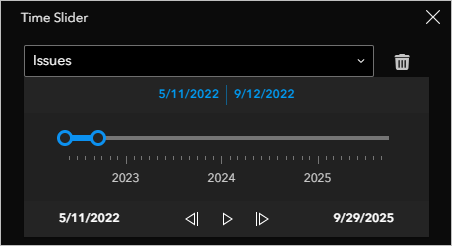
The Time Slider widget allows you to view temporal data and see how that data changes over time. Using this widget, you can animate data from multiple layers with play and pause or previous and next buttons, or by dragging the slider.
Note:
Issues, Schedules, and BIM project layers are available in the Time Slider widget by default. To include additional layers for Time Slider analysis, see Enable time on layers.
Use cases
The Time Slider widget allows you to perform tasks such as the following:
- Present schedule data over time to support project planning procedures.
- Analyze geographical context of BIM project completion dates.
- Analyze project issues created over time and when these issues are frequently arising.
Filter layers
To filter the layers in an ArcGIS GeoBIM app using Time Slider, complete the following steps:
- Click the Time Slider widget
 .
.The Time Slider widget opens in the Map view.
- Click the Select layers drop-down arrow and select layers to include in the temporal analysis.
Note:
Time Slider will only show layers that have time settings enabled.
The Time Slider display will update and show the overall time range for the selected layers, as well as the default time range set for the slider.

- Drag the slide controls or click the navigation arrows

 to edit the time range.
As the time range changes the selected layers will filter accordingly in the Map and Table widgets.
- Click the Play button
 to start the time animation.
The Map widget displays the animation while the Time Slider analysis runs. The Table widget filter will only update once the animation has stopped.
Note:
The animation will continue to run even if the Time Slider widget is closed.
- To stop the animation, click the Pause button
 .
. - To clear the selected layers from the Time Slider, click the Trash button
 .
.The Time Slider widget will revert back to its default display.
After completing the steps above you will have successfully filtered your ArcGIS GeoBIM project layers using Time Slider temporal analysis.