ArcGIS AllSource allows intelligence professionals to visualize, explore, and analyze disparate data to produce actionable intelligence. Explore data from multiple sources and perform advanced analytics, such as spatial, temporal, statistical, predictive, and relational analysis.
ArcGIS AllSource includes tools to directly connect to data. Data can come from relational databases, web services, spreadsheets, and unstructured documents. Visualize data in 2D or 3D maps, link charts, timelines, tables, and graphs. Ask complex questions about the data using a variety of analytical techniques to uncover patterns, trends, forecasts, correlations, and relationships.
Intelligence analysts can analyze, assess, process, and distribute tactical intelligence about threats and potential areas of conflict. Using multidimensional analysis, an intelligence analyst can visualize data from many sources, putting new data in context with existing intelligence so that commanders and operators have the most up-to-date and actionable information possible.
Law enforcement intelligence professionals assist officers with the apprehension of criminal offenders by evaluating case information and intelligence. Using spatial, temporal, and relational analysis tools and techniques, law enforcement intelligence professionals can conduct analysis on subjects’ histories to identify associations, addresses, and vehicles to procure suspect leads and targets for surveillance or directed patrol.
Imagery intelligence analysts provide vulnerability and security analysis in support of force protection, antiterrorism planning, risk assessments, and protective operations. Using advanced imagery and motion imageryexploitation tools, imagery analysts can apply amplifying information and capture structured observations to produce imagery-derived graphic products and reports.
Build projects and add data
ArcGIS AllSource organizes the resources you use into projects. A project can contain maps; layouts; layers; tables; tasks; tools; and connections to servers, databases, folders, and styles. Projects can also incorporate content from your ArcGIS Enterprise portal or ArcGIS Online.
The following is a general workflow for getting started:
- Build a project, or open a project template.
- Add data to the project.
- Save the project so it's ready the next time you start ArcGIS AllSource.
- To disseminate a project, you can create project templates for others to use as a starting point, or package the project and its data.
- Configure ArcGIS AllSource by setting project and application options and customizing the ribbon.
With ArcGIS AllSource, you can create, edit, and integrate data from many sources into a project. You can visualize the layers you are working with in 2D and 3D maps, link charts, timelines, and graphs, so you can see them from various perspectives.
Visualize data
Explore all sources of intelligence information and develop understanding through detailed visuals. Use 2D and 3D maps, link charts, timelines, and graphs to integrate data about locations, times, and relationships.
Maps display 2D data, and scenes are 3D. You can store as many maps as necessary in a project, and you can open multiple maps at once and view them side by side. Link views so that when you pan and zoom, the extents of all the maps update simultaneously.
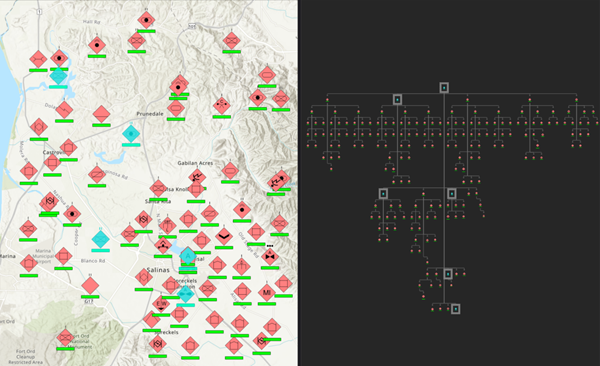
View the relationships between spatial and nonspatial entities using link charts. Entities can include people, groups, places, and other things. Visualize complex relationships in the data to reveal previously unknown connections. You can open multiple link charts at once and view them side by side, and view a link chart side by side with a map. You can analyze the network of connected entities in the link chart with link analysis.

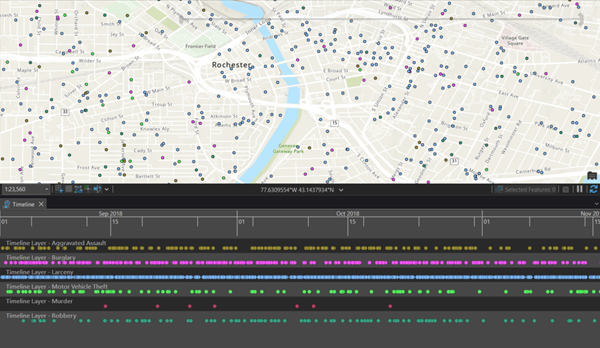
Visualize data on a temporal axis using timelines.

Perform analysis
Use focused tools to support many mission sets, including threat assessments, link analysis, investigative support, imagery exploitation, and location analysis.
You can do the following with ArcGIS AllSource:
- Analyze activities in space and time to determine patterns, trends, and statistical significance to assess potential threats.
- Use exploratory link analysis techniques to uncover correlations and relationships in the data for investigative support.
- Expand simple map visualizations by integrating location data into the analysis to perform site suitability, find clusters, make predictions, and quantify how patterns change over time.
- Exploit imagery and motion imagery to extract essential elements of information.
Symbology
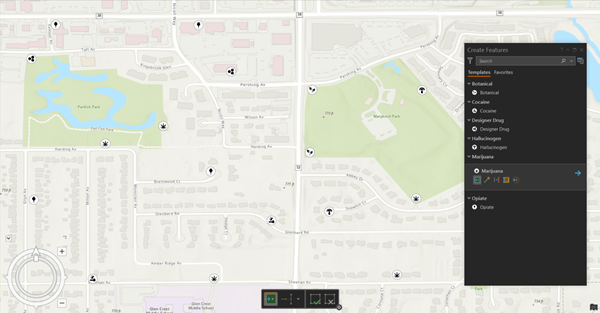
ArcGIS AllSource includes a library of community-evaluated symbols with layer templates and styles.

Symbology sets include the following:
- Entities
- Drugs
- Weapons
- Pattern of life
- Dignitary protection
- Law enforcement
- Critical Infrastructure
- Damage Assessment
Disseminate your work
Disseminating your work with those who need it, and when and how they need it, is an important part of ArcGIS AllSource. Disseminate your work with analysts, and share final assessments with stakeholders for more informed decision making.
You can do the following with ArcGIS AllSource:
- Create large- or small-format printable products. After you've created a product, you can disseminate it as a file or print it.
- Publish services for web-based dissemination of data and analytical results.
- Export analytical results to several industry-standard file formats to integrate with other business systems.
- Disseminate best practices and workflows through project templates and project packages.