Available with Network Analyst license.
The origin-destination (OD) cost matrix solver finds and measures the least-cost paths along the network from multiple origins to multiple destinations. The best path on the street network is calculated for each origin-destination pair, and the travel times and travel distances are stored as attributes of the output lines. In this tutorial, you'll use this tool to create an OD cost matrix showing the travel time from patients to hospitals and use the results to identify patients with poor access to hospitals.
Note:
This tutorial can be completed using the designated tutorial network dataset, ArcGIS Online, or an ArcGIS Enterprise routing service published using a network dataset that covers the geography of the input data of the analysis as the network data source. If you use ArcGIS Online as the network data source, credits will be consumed.Get the data
The data for this tutorial is available for download.
- Go to the data download page.
- Click the Download button, and save the file locally.
- Unzip the downloaded file.
Create a map
To create a map, complete the following steps:
- Start ArcGIS AllSource.
- Click the Map template to create a project. Optionally, change the name of the project and location.
- Click OK.
A new project with a map appears.
Add the tutorial data to the project
A network dataset models the road system. It contains not only the location and attributes of roads, but also information about how roads relate to one another, such as which roads are connected, which turns between connected roads are allowed or prohibited, and other information that affects what travel paths are possible and how long travel takes. The OD cost matrix solver references the network dataset to calculate the travel time or distance from origins to destinations.
Note:
If you perform an analysis using ArcGIS Online, the solver references a high-quality, worldwide network dataset stored in the ArcGIS Online cloud and uses ArcGIS Online credits. You can also use your own network dataset stored locally on your machine or use ArcGIS Enterprise to publish routing services using your own network dataset and configure the services with your enterprise portal to consume them from ArcGIS AllSource.To add a network dataset to the map, complete the following steps:
- In the Catalog pane, which is on the right side of the application by default, right-click Folders, and choose Add Folder Connection
 .
.The Add Folder Connection dialog box appears.
- Browse to the folder where you placed the tutorial data, double-click Network Analyst, and click Tutorial to select the folder.
- Click OK.
A connection to the Tutorial folder is created.
- In the Catalog pane, expand Folders > Tutorial > SanFrancisco.gdb > Transportation.
- Drag Streets_ND, which has a network dataset icon
 , onto the map.
 The network dataset is added to the Contents pane as well as to the map.
- In the Catalog pane, browse to Tutorial > SanFrancisco.gdb > Analysis.
- Right-click the Patients layer and choose Add to Current Map
 .
.The Patients layer is added to the Contents pane as well as to the map.
- Right-click the Hospitals layer and choose Add to Current Map
 .
.The Hospitals layer is added to the Contents pane as well as to the map.
Next, add one of the network datasets contained in the folder to the map.
Note:
You do not need to add the network dataset to the map if you intend to use ArcGIS Online or an ArcGIS Enterprise routing service as the network data source.
Create an OD Cost Matrix between patients and hospitals
In this section, you'll perform an OD cost matrix analysis to calculate the driving time between each patient and each hospital. You'll create the OD Cost Matrix layer, load patients as origins and hospitals as destinations, solve the analysis, and examine the results.
Create the OD Cost Matrix layer
The OD cost matrix analysis layer stores all the inputs, parameters, and results of an OD cost matrix analysis.
- On the Analysis tab, in the Workflows group, click Network Analysis > Origin-Destination Cost Matrix
 .
.The OD Cost Matrix layer is added to the Contents pane. It includes several sublayers that contain the inputs and outputs of the analysis.
The OD Cost Matrix layer references the San Francisco network dataset because this network was set as the map's network data source when the layer was created.
Note:
To see or change the network data source that will be used to create the network analysis layer, on the Analysis tab, in the Workflows group, you can click the Network Analysis drop-down arrow and look under Network Data Source. Changing this value does not affect the network data source of existing network analysis layers; only new network analysis layers created after the network data source are updated. - In the Contents pane, click OD Cost Matrix to select the group layer.
The OD Cost Matrix Layer tab appears.
- Click the OD Cost Matrix Layer tab to see the tab's controls.
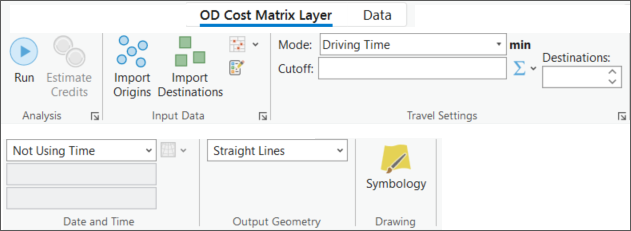
You'll use these controls to configure the settings for the OD cost matrix you want to generate.
Tip:
The OD Cost Matrix Layer tab appears only when you select the OD Cost Matrix layer or one of its sublayers in the Contents pane. Also, if you have multiple OD cost matrix layers, you can change the settings of the layers individually or select the multiple layers to edit the settings for all the selected layers if they share the same network data source.
- On the OD Cost Matrix Layer tab, in the Travel Settings group, ensure that Driving Time is selected for Mode.
This OD cost matrix will calculate the driving time between origins and destinations.
Add origins
Because the goal is to calculate the driving time from patients to hospitals, you'll use the Patients feature class as the origins for the OD cost matrix. To do this, you must load the data from the Patients feature class into the Origins sublayer of the OD Cost Matrix layer.
- On the OD Cost Matrix Layer tab, in the Input Data group,
click Import Origins
 .
.The Add Locations window appears.
- Make sure Input Network Analysis Layer is set to OD Cost Matrix and Sub Layer is set to Origins.
- Click the drop-down menu below Input Locations and choose Patients.
- Under Field Mappings, select the Name property set Field Name to PatientID.
Use Field Mappings to transfer field values from the input data to the fields in the network analysis layer's schema. By mapping the PatientID field to the Name property of the Origins sublayer, you can use the values in the Name field later to join the OD cost matrix results back to the original input data.
Tip:
The PatientID field in the Patients feature class is a text field, and so is the Name field in the Origins sublayer. Consequently, if you populate the Name field with PatientID values, you can join values from the Origins table back to the original Patients feature class. However, if your data has a unique identifier of a different data type, joins from the Origins Name field won't work because the field data types won't match.
You can transfer any field from the input feature class into a network analysis layer sublayer, and this is often helpful to use for joins:
- Use the Add Field To Analysis Layer tool to add a field to the network analysis layer's sublayer.
- When loading input data with the Add Locations tool, use field mappings to map the fields from the input data to the fields you added in the previous step.
- When the analysis is finished, use the added fields for joins or other analysis steps.
- Leave the default settings for the rest of the parameters and click the OK button.
Ten patients load as origins.
Add destinations
Because the goal is to calculate the driving time from patients to hospitals, you'll use the Hospitals feature class as the destinations for the OD cost matrix. To do this, you must load the data from the Hospitals feature class into the Destinations sublayer of the OD Cost Matrix layer.
- On the OD Cost Matrix Layer tab, in the Input Data group,
click Import Destinations
 .
.The Add Locations window appears.
- Make sure Input Network Analysis Layer is set to OD Cost Matrix and Sub Layer is set to Destinations.
- Click the drop-down menu below Input Locations and choose Hospitals.
- Under Field Mappings, select the Name property and verify that the NAME field from the input Hospitals feature class has been automatically mapped to it.
Use Field Mappings to transfer field values from the input data to the fields in the network analysis layer's schema.
- Leave the default settings for the rest of the parameters and click the OK button.
Twenty-two hospitals load as destinations.
Run the analysis to create the OD cost matrix
To run the analysis, complete the following steps:
- On the OD Cost Matrix Layer tab, click Run
 .
.When the solve process is complete, origin-destination lines appear on the map. A straight line appears between each origin and each destination. Although the lines are straight, the driving times, which you will examine next, were calculated using travel along the road network.
- In the Contents pane, expand the OD Cost Matrix group layer if not already expanded.
- Right-click the OD Cost Matrix:Lines sublayer and click Attribute Table.
The attribute table of the Lines sublayer represents the origin-destination cost matrix from each patient to each hospital. Each row in the table represents an origin-destination pair. The Total_TravelTime field shows the driving time in minutes from each origin to each destination because the Driving Time travel mode used for the analysis uses the TravelTime cost attribute, which has units of minutes. The other fields with names that start with Total_ are associated with the network dataset's other cost attributes that were not used in this analysis.
- Close the attribute table.
Determine which patients have poor access to hospitals
An OD cost matrix is often used when studying access to destinations. In the next part of this tutorial, you'll determine which patients don’t have access to a hospital within a 10-minute driving time and update a field in the Patients feature class with this information. You'll resolve the OD Cost Matrix layer with updated settings and use joins to transfer the results back to the Patients feature class.
Update the analysis settings and solve again
The previous OD cost matrix included the driving time from every patient to every hospital. For this analysis, you will update the OD Cost Matrix layer's settings to limit the results to include only the closest hospital within a 10-minute driving time limit for each patient.
- On the OD Cost Matrix Layer tab,
in the Travel Settings group, set the Destinations text box to 1.
This setting limits the number of destinations to find for each origin. The OD cost matrix results will include the driving time to the closest hospital to each patient instead of the driving time to all hospitals.
- On the OD Cost Matrix Layer tab,
in the Travel Settings group, set the Cutoff text box to 10.
This setting limits the results to include only records where the driving time from the patient to the hospital is less than or equal to the specified time limit.
The Driving Time travel mode uses the TravelTime cost attribute, which has units of minutes. Consequently, the Cutoff value is interpreted in units of minutes.
- On the OD Cost Matrix Layer tab, click Run
 to solve the analysis again.
When the solve process is complete, you will see fewer lines in the map than previously because of the limits imposed. You will also see that the Solve tool has returned warning messages informing you that a partial solution is generated because no destinations were found for two of the origins. This is because the solver couldn't find any destinations (hospitals) within the 10-minute driving time cutoff of those two origins (patients).
- Right-click the OD Cost Matrix:Lines sublayer and click Attribute Table.
No more than one row appears in the table for each origin. No rows appear for the two origins specified in the warning messages because they were not connected to any destinations.
- Close the attribute table.
Join the OD cost matrix results to the original data
The goal of the analysis is to determine which patients have poor access to hospitals. In this section, you will join the results of the OD cost matrix analysis to the Patients feature class and calculate a field to flag patients who don't have access to a hospital within a 10-minute driving time.
- Right-click the OD Cost Matrix:Origins sublayer and click Joins and Relates > Add Join.
The Add Join tool appears.
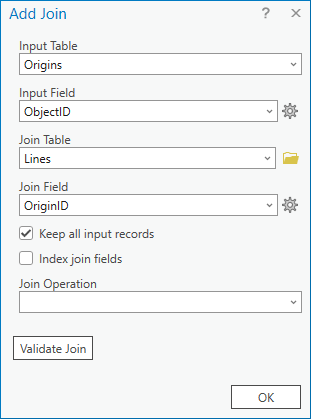
- Verify that the Input Table parameter is set to Origins.
- Set the Input Field parameter to ObjectID.
- Set the Join Table parameter to OD Cost Matrix\Lines.
- Set the Join Field parameter to OriginID.
The OriginID field in the Lines sublayer corresponds to the ObjectID field in the Origins sublayer. Consequently, it can be used for joins.
- Leave the default settings for the rest of the parameters and click the OK button.
The data from the Lines sublayer is joined to the Origins sublayer.
- Right-click the OD Cost Matrix:Origins sublayer and click Attribute Table.
The attribute table of the Origins sublayer includes the joined data from the Lines sublayer.
- Find the Total_TravelTime field and examine the values.
For two origins, the value of this field is null because no records in the Lines sublayer were associated with these origins. These are the patients for whom no hospital could be reached within the 10-minute driving time limit.
- Close the attribute table.
- Right-click the Patients layer and click Joins and Relates > Add Join.
The Add Join tool appears.
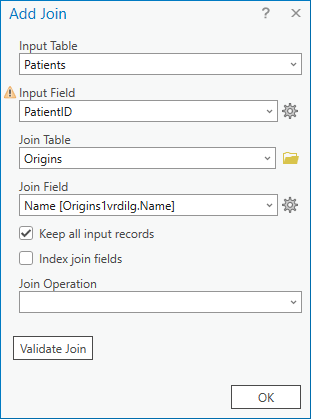
- Verify that the Input Table parameter is set to Patients.
- Set the Input Field parameter to PatientID.
- Set the Join Table parameter to OD Cost Matrix\Origins.
- Set the Join Field parameter to Name.
Caution:
The joined Origins table includes two fields called Name. One is from the Origins sublayer, and the other is a joined field from the Lines sublayer. Use the Name field from the Origins sublayer. The list of fields in the Join Field parameter may include some additional text next to the field name indicating which table it comes from. That text is the automatically generated feature class name for the Origins sublayer, which is typically the text Origins followed by some random characters.Because you mapped the PatientID field to the Origins sublayer's Name field earlier, the values can be used for joins.
- Leave the default settings for the rest of the parameters and click the OK button.
The data from the OD cost matrix is joined to the Patients layer.
- Right-click the Patients layer and click Attribute Table.
The data from the combined Lines and Origins sublayer of the OD Cost Matrix layer are included in the Patients attribute table.
- Find the Total_TravelTime field and examine the values.
Just as you saw after joining the Lines sublayer to the Origins sublayer, two rows in the Patients table have a null Total_TravelTime field value because no hospitals could be reached within the 10 minutes. These are the patients with poor access to hospitals that should be flagged for follow-up.
- On the Map tab, in the Selection group, click the Select By Attributes button
 .
.The Select Layer By Attribute tool opens.
- Set the Input Rows parameter to Patients, if necessary.
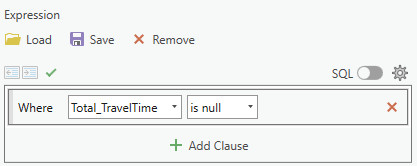
- Configure the Expression parameter to select patients where the Total_TravelTime field is null.
- Leave the default settings for the rest of the parameters and click the OK button.
Patients without access to a hospital within 10 minutes are selected.
- In the attribute table for Patients, find the PoorAccess field.
- Right-click the PoorAccess field header and click Calculate Field.
The Calculate Field tool opens.
- Verify that the Input Table parameter is set to Patients and the Field Name parameter is set to PoorAccess.
- Configure the Expression parameter to calculate the PoorAccess field to a value of 1 by setting the text box labeled Patients.PoorAccess = to 1.
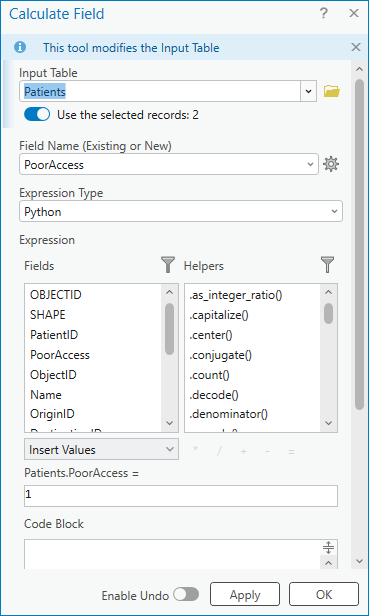
- Leave the default settings for the rest of the parameters and click the OK button.
The PoorAccess field is set to 1 for the selected rows.
- Right-click the Patients layer and click Joins and Relates > Remove All Joins.
The joined data is removed from the Patients layer.