In ArcGIS AllSource, charts are linked to and stored with the chart's source layer. Charts are not a separate file or project item, rather they are an extension of the source layer. To share a chart, you can do the following:
- Share the chart's source layer as a layer package or web feature layer.
- Share the map the source layer is in as a map package or web map.
- Share the project the map is in as a project package.
- Export the chart as a graphic file.
- Add the chart to a layout.
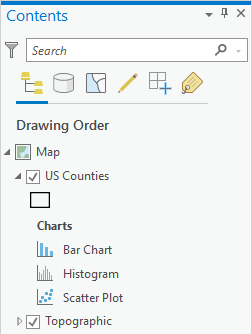
Charts are listed under their source layer in the Contents pane, on the List By Drawing Order tab  .
.

Learn more about managing the charts in your project
Share layers, maps, and projects
All of a chart's properties, including the variables specified, properties, title, and format, are maintained with the source layer you share so a shared chart will have the data and settings necessary to appear exactly as the chart was authored.
Use a shared chart
After adding or opening the shared layer, map, or project in ArcGIS AllSource, the charts will be listed under their source layer in the Contents pane, on the List By Drawing Order tab  . You can open the shared chart and interact and manage it in the same manner as other charts.
Export a chart
Charts can be exported as a graphic file or table using the Export button  in the chart window.
To export a chart to a graphics file, complete the following steps:
- From a chart, click the Export pull-down menu
 and click the Export As Graphic button
  .
.The Export dialog box appears.
- Browse to a folder to store the new graphic.
- Choose an .svg, .jpg, or .png file type, and enter pixel values in the Width and Height text boxes.
- Click Save to export to a file.
The graphic file is exported.
Alternatively, the chart graphics can be captured to the system clipboard, which can then be pasted into a third-party application. To capture a chart to the clipboard, complete the following steps:
- From a chart, click the Export pull-down menu
 and click the Capture To Clipboard button
  .
. - Paste the chart graphics into any application that supports graphics.
Some charts can be exported as a table that includes the summarized fields and values displayed in the chart. Chart types that support being exported to a table are bar chart, line chart, histogram, box plot, data clock, calendar heat chart, and matrix heat chart.
To export a chart to a table, complete the following steps:
- From a chart, click the Export pull-down menu
 and click the Export As Table button
  .
.The Export dialog box appears
- Browse to a folder or geodatabase to store the new table.
- Choose a geodatabase table or .csv file as the output type.
- Click the Save button to export to a table.
The table is exported.
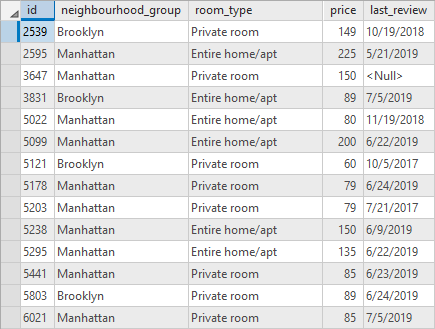
Consider a dataset with the following attribute table:

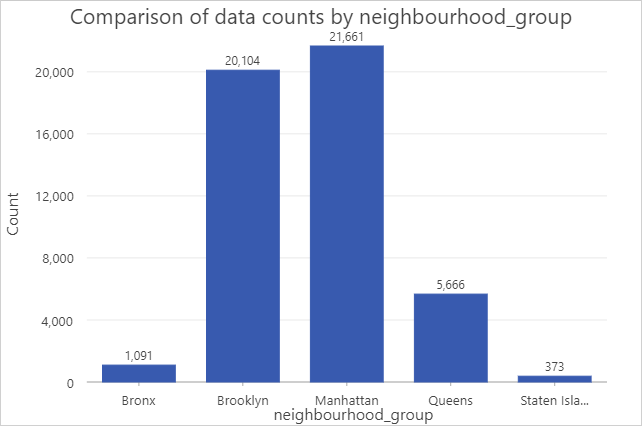
You may want to create a bar chart to investigate the distribution of the neighbourhood_group field categories, such as the following:

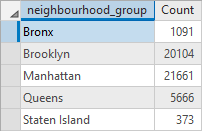
When you export this chart to a table, you now have the following table that summarizes the bar chart:

Other ways to use a rendered chart
Charts can also be added to a layout or a report as a chart frame.