Rescale by Function (Spatial Analyst)

Summary

Rescales the input raster values by applying a selected transformation function and transforming the resulting values onto a specified continuous evaluation scale.

Learn more about how Rescale by Function works

Usage

  • The primary benefits of using this tool over other reclassification methods is the greater level of control over how the input values are reclassified:

    • Accepts and directly processes continuous input values without requiring the values to be grouped into categories.
    • Allows for linear and nonlinear continuous functions to be applied to the input data.
    • Rescales the input values onto a continuous floating-point evaluation scale.

  • Reviewing the essential vocabulary for this tool may help with understanding the following explanations.

  • Rescaling input data on a continuous scale is conceptually a two-step process:

    1. Apply the specified function to the input raster values.
    2. Linearly transform the function values to a specified evaluation scale. In an ascending evaluation scale, the minimum and maximum function values are set to the specified minimum (From scale) and maximum (To scale) of the evaluation scale, respectively. However, the evaluation scale can also be reversed for a descending scale.

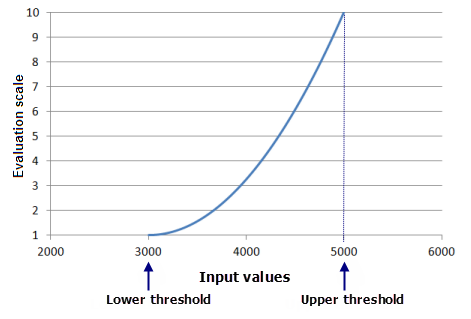
  • The following illustration shows an example of a Power function graph to introduce the general concepts and terminology associated with applying a transformation function.

    An example plot of the Power function, with a value of 2 for the exponent and an evaluation scale of 1 to 10
    An example plot of the Power function, with a value of 2 for the exponent and an evaluation scale of 1 to 10

    The input data range for this example is from 3,000 to 5,000. The lowest value in the input raster is set to the Lower threshold value and the highest to the Upper threshold (seen on the x-axis), with the Power function being constrained (fit) between the thresholds. Shape-controlling parameters define the shape of the function--such as Input shift and Exponent for the Power function--allowing you to control where the function begins and how steeply it will rise. The resulting function values from the Power function are then linearly transformed to the evaluation scale to assign the output values. In the graph above, a 1 to 10 evaluation scale has been defined using the From scale and To scale parameters, as can be seen on the y-axis.

  • By default, the minimum value from the Input raster is assigned to the Lower threshold value and the maximum value to the Upper threshold value.

  • By default, the specified function is constrained (fit) between the lower and upper thresholds, if possible, using the Input raster values. How the function is fit between the lower and upper thresholds varies based on the particular transformation function being used in the following ways:

    • Linear and Symmetrical Linear functions, by definition, are fitted since the minimum and maximum of the functions are set to the minimum (the lower threshold) and maximum (the upper threshold) of the Input raster.
    • A fitted version of the Exponential and Logarithm functions is applied to the values from the Input raster.
    • As many of the parameters as possible are derived from the Input raster (for example, the Midpoint, Factor, and Input shift) to obtain the best fit for Gaussian, Near, Small, MS Small, Large, MS Large, Power, Logistic Growth, and Logistic Decay functions.

  • When the Lower threshold and Upper threshold values are altered, the following interactions apply:

    1. If an input cell has a value lower than the Lower threshold, it will be assigned to the value set in the Value below threshold parameter.
    2. If an input cell has a value greater than the Upper threshold, it will be assigned to the value set in the Value above threshold parameter.
    3. All cell values, including and between the Lower threshold and Upper threshold, will be assigned to the corresponding evaluation scale based on the function value, f(x). In certain cases, when a shape-controlling parameter (for example, Spread and Exponent) is altered, the output raster may not have any cells assigned to the From scale or To scale values.

  • By default, the parameters defining the shape of the function (for example, Spread or Base factor) will be calculated to best fit (constrain) the function to the minimum and maximum of the Input raster. However, the shape-controlling parameters can be altered to refine the fit of the function to the preference interaction of the phenomenon to the criterion values. When a value is specified for any shape-controlling parameter, the resulting function, in conjunction with the lower and upper threshold values, will be used in rescaling the Input raster values; the fitted version on the function will not be used.

  • The From scale and To scale define the upper and lower values of the continuous evaluation scale. The smallest function value is assigned to the value set for From scale and the largest function value is assigned to the value set for the To scale. All function values in between are assigned to the appropriate evaluation values.

  • The evaluation scale can be set to range from low to high (for example, 1 to 10) or from high to low (for example, 10 to 1).

  • The Value below threshold and Value above threshold values are assigned to all cells that have an input value below and above the thresholds, respectively. These values are assigned directly to the final output raster, and these cells are not considered in the processing of the transformation function.

  • In the tool dialog box, generally when the Lower threshold or Upper threshold is altered, the shape-controlling parameters—parameters defining the shape of the function, for example, Spread or Base factor—are automatically recalculated. However, when a shape-controlling parameter is altered, the Lower threshold and Upper threshold values will not change automatically, and if the Lower threshold or Upper threshold is subsequently changed, the altered shape-controlling parameter (and any other associated shape-controlling parameters) will retain the changed setting and it will not be recalculated.

  • The shape-controlling parameters for the function (for example, Spread or Base factor) and the lower and upper thresholds are based on statistics calculated for the current processing extent, cell size, and snap raster environment settings. If none of these are set, the statistics associated with the full extent of the input raster are used.

  • In the tool dialog box, if the input raster does not have valid statistics to calculate the shape-controlling parameters or to determine the thresholds, these parameters will be empty and you will receive a warning message. You will need to click the Calculate Statistics button to recalculate statistics to the current environment settings to populate the parameters. The Lower threshold value will default to the minimum value within the processing extent. and the Upper threshold to the maximum value, with the shape-controlling parameter values appropriately determined. You may not have valid statistics for the following conditions:

    • The environment processing extent, cell size, or snap raster is set prior to launching the tool dialog box.
    • The input raster does not have statistics.

  • In the tool dialog box, if the environment processing extent, cell size, or snap raster is changed after an input raster is entered and a function has been specified, the function parameters may be set to empty (no value in the parameter). Click the Calculate Stats button to repopulate the parameters to view the values for the new extent. If the Lower threshold, Upper threshold, or any shape-controlling parameters are changed by typing in a value, the tool will track that these parameters have been altered. If the processing extent is changed, the values for these parameters will remain as specified after clicking the Calculate Stats button.

  • Multiple functions can be applied to different ranges of the input raster. To do so, the functions can be concatenated by running the Rescale by Function tool multiple times, first specifying a transformation function for a certain range of the input values and then running it again, applying another function to a different range of the values. The resulting output rasters are then combined, for example

    1. Run Rescale by Function applying a linear function to the input values from 1,500 to 3,200 and set the values above and below the thresholds to 0.
    2. Run the tool a second time on the same input raster, this time, applying an Exponential function to the values greater than 3,200 and up to 5,000, and set the values above and below the thresholds to 0.
    3. Add the two resulting output rasters together with the Plus tool.

Parameters

LabelExplanationData Type
Input raster

The input raster to rescale.

Raster Layer
Transformation function
(Optional)

Specifies the continuous function to transform the values from the input raster.

The transformation functions are used to specify the function to rescale the input data. A general description of each function and the default values for the functions are detailed in the table below.

  • ExponentialRescale input values using an exponential function.Use when the preference increases with an increase in the input values and the preference increases more rapidly as the input values become larger.
    • Input shift—The default is derived from the input raster.
    • Base factor—The default is derived from the input raster.
    • Lower threshold—The default is the minimum of the input raster.
    • Value below threshold—The default is the From scale value.
    • Upper threshold—The default is the maximum of the input raster.
    • Value above threshold—The default is the To scale value.
  • GaussianRescale input values using a Gaussian function.The midpoint of the normal distribution defines the most preferred value and is generally assigned to the To scale. Preference values decrease as the values move from the midpoint until eventually reaching the least preference with the lowest and highest input values generally being assigned to the From scale.
    • Midpoint—The default is derived from the input raster.
    • Spread—The default is derived from the input raster.
    • Lower threshold—The default is the minimum of the input raster.
    • Value below threshold—The default is the From scale value.
    • Upper threshold—The default is the maximum of the input raster.
    • Value above threshold—The default is the To scale value.
  • LargeUsed to indicate that the larger values from the input raster have higher preference.The midpoint identifies the crossover point with input values greater than the midpoint having increasing preference and values below having decreasing preference.
    • Midpoint—The default is derived from the input raster.
    • Spread—The default is 5.
    • Lower threshold—The default is the minimum of the input raster.
    • Value below threshold—The default is the From scale value.
    • Upper threshold—The default is the maximum of the input raster.
    • Value above threshold—The default is the To scale value.
  • LinearRescale the input values using a linear function.When the minimum is less than the maximum the larger values are more preferred.
    • Minimum—The default is the minimum of the input raster.
    • Maximum—The default is the maximum of the input raster.
    • Lower threshold—The default is the minimum of the input raster.
    • Value below threshold—The default is the From scale value.
    • Upper threshold—The default is the maximum of the input raster.
    • Value above threshold—The default is the To scale value.
  • LogarithmRescale input data using a logarithm function.Used when the preference for the lower input values increases rapidly. As the input values increase, the preference tapers off, with a further increase in the input values.
    • Input shift—The default is derived from the input raster.
    • Factor—The default is derived from the input raster.
    • Lower threshold—The default is the minimum of the input raster.
    • Value below threshold—The default is the From scale value.
    • Upper threshold—The default is the maximum of the input raster.
    • Value above threshold—The default is the To scale value.
  • LogisticDecayRescale input data using a logistic decay function.Used when small input values are most preferred. As the values increase, the preferences rapidly decrease, until the preferences taper off at the larger input values.
    • Minimum—The default is the minimum of the input raster.
    • Maximum—The default is the maximum of the input raster.
    • Y intercept percent—The default is 99.0.
    • Lower threshold—The default is the minimum of the input raster.
    • Value below threshold—The default is the From scale value.
    • Upper threshold—The default is the maximum of the input raster.
    • Value above threshold—The default is the To scale value.
  • LogisticGrowthRescale input data using a logistic growth function.Used when small input values are least preferred. As the values increase, the preferences rapidly increase, until the preferences taper off at the larger input values.
    • Minimum—The default is the minimum of the input raster.
    • Maximum—The default is the maximum of the input raster.
    • Y intercept percent—The default is 1.0.
    • Lower threshold—The default is the minimum of the input raster.
    • Value below threshold—The default is the From scale value.
    • Upper threshold—The default is the maximum of the input raster.
    • Value above threshold—The default is the To scale value.
  • MSLargeRescale input data based on the mean and standard deviation, where larger values in the input raster have higher preference.The result can be similar to the Large function, depending on how the multipliers of the mean and standard deviation are defined.
    • Mean multiplier—The default is 1.
    • Standard deviation multiplier—The default is 1.
    • Lower threshold—The default is the minimum of the input raster.
    • Value below threshold—The default is the From scale value.
    • Upper threshold—The default is the maximum of the input raster.
    • Value above threshold—The default is the To scale value.
  • MSSmallRescale input data based on the mean and standard deviation, where smaller values in the input raster have higher preference.The result can be similar to the Small function, depending on how the multipliers of the mean and standard deviation are defined.
    • Mean multiplier—The default is 1.
    • Standard deviation multiplier—The default is 1.
    • Lower threshold—The default is the minimum of the input raster.
    • Value below threshold—The default is the From scale value.
    • Upper threshold—The default is the maximum of the input raster.
    • Value above threshold—The default is the To scale value.
  • NearUse when the input values very close to the midpoint are preferred.Near is similar to the Gaussian function but decreases at a faster rate.
    • Midpoint—The default is derived from the input raster.
    • Spread—The default is derived from the input raster.
    • Lower threshold—The default is the minimum of the input raster.
    • Value below threshold—The default is the From scale value.
    • Upper threshold—The default is the maximum of the input raster.
    • Value above threshold—The default is the To scale value.
  • PowerRescale the input data, applying a power function using a specified exponent.Use when the preference for the input values increases rapidly, with an increase in the input values.
    • Input shift—The default is derived from the input raster.
    • Exponent—The default is derived from the input raster.
    • Lower threshold—The default is the minimum of the input raster.
    • Value below threshold—The default is the From scale value.
    • Upper threshold—The default is the maximum of the input raster.
    • Value above threshold—The default is the To scale value.
  • SmallUse to indicate that the smaller values from the input raster have higher preference.The midpoint identifies the crossover point, with input values below the midpoint having increasing preference, and values that are greater having decreasing preference.
    • Midpoint—The default is derived from the input raster.
    • Spread—The default is 5.
    • Lower threshold—The default is the minimum of the input raster.
    • Value below threshold—The default is the From scale value.
    • Upper threshold—The default is the maximum of the input raster.
    • Value above threshold—The default is the To scale value.
  • SymmetricLinearRescale input data by mirroring a linear function around the midpoint of the minimum and maximum.Use when a particular input value is the most preferred, with the preferences decreasing linearly as the input values move from the mirrored point.
    • Minimum—The default is the minimum of the input raster.
    • Maximum—The default is the maximum of the input raster.
    • Lower threshold—The default is the minimum of the input raster.
    • Value below threshold—The default is the From scale value.
    • Upper threshold—The default is the maximum of the input raster.
    • Value above threshold—The default is the To scale value.

The default transformation is MS Small.

Transformation function
From scale
(Optional)

The starting value of the output evaluation scale.

The From scale value cannot be equal to the To scale value. The From scale can be lower or higher than the To scale (for example, from 1 to 10, or from 10 to 1).

The value must be positive and it can be either an integer or double.

The default is 1.

Double
To scale
(Optional)

The ending value of the output evaluation scale.

The To scale value cannot be equal to the From scale value. The To scale can be lower or higher than the From scale (for example, from 1 to 10, or from 10 to 1).

The value must be positive and it can be either an integer or double.

The default is 10.

Double

Return Value

LabelExplanationData Type
Output raster

The output rescaled raster.

The output will be a floating-point raster with values ranging from (or within) the from_scale and the to_scale evaluation values.

Raster

RescaleByFunction(in_raster, {transformation_function}, {from_scale}, {to_scale})
NameExplanationData Type
in_raster

The input raster to rescale.

Raster Layer
transformation_function
(Optional)

Specifies the continuous function to transform the input raster.

The transformation function classes are used to specify the type of transformation function.

The types of transformation function classes are

Which transformation function to use depends on which function best captures the interaction of the phenomenon's preference to the input values. To better understand how the lower and upper thresholds affect the output values, For more information on the parameters that control the thresholds, see The interaction of the lower and upper thresholds on the output values.

The following are the forms of the transformation function classes:

  • TfExponential({shift}, {baseFactor}, {lowerThreshold}, {valueBelowThreshold}, {upperThreshold}, {valueAboveThreshold})
  • TfGaussian({midpoint}, {spread}, {lowerThreshold}, {valueBelowThreshold}, {upperThreshold}, {valueAboveThreshold})
  • TfLarge({midpoint}, {spread}, {lowerThreshold}, {valueBelowThreshold}, {upperThreshold}, {valueAboveThreshold})
  • TfLinear({minimum}, {maximum}, {lowerThreshold}, {valueBelowThreshold}, {upperThreshold}, {valueAboveThreshold})
  • TfLogarithm({shift}, {factor}, {lowerThreshold}, {valueBelowThreshold}, {upperThreshold}, {valueAboveThreshold})
  • TfLogisticDecay({minimum}, {maximum}, {yInterceptPercent}, {lowerThreshold}, {valueBelowThreshold}, {upperThreshold}, {valueAboveThreshold})
  • TfLogisticGrowth({minimum}, {maximum}, {yInterceptPercent}, {lowerThreshold}, {valueBelowThreshold}, {upperThreshold}, {valueAboveThreshold})
  • TfMSLarge({meanMultiplier}, {STDMultiplier}, {lowerThreshold}, {valueBelowThreshold}, {upperThreshold}, {valueAboveThreshold})
  • TfMSSmall({meanMultiplier}, {STDMultiplier}, {lowerThreshold}, {valueBelowThreshold}, {upperThreshold}, {valueAboveThreshold})
  • TfNear({midpoint}, {spread}, {lowerThreshold}, {valueBelowThreshold}, {upperThreshold}, {valueAboveThreshold})
  • TfPower({shift}, {exponent}, {lowerThreshold}, {valueBelowThreshold}, {upperThreshold}, {valueAboveThreshold})
  • TfSmall({midpoint}, {spread}, {lowerThreshold}, {valueBelowThreshold}, {upperThreshold}, {valueAboveThreshold})
  • TfSymmetricLinear({minimum}, {maximum}, {lowerThreshold}, {valueBelowThreshold}, {upperThreshold}, {valueAboveThreshold})

The default transformation function is TfMSSmall.

The parameter defaults for the transformation functions include the following:

  • baseFactor (for TfExponential) is derived from the input raster.
  • exponent (for TfPower) is derived from the input raster.
  • factor (for TfLogarithm) is derived from the input raster.
  • lowerThreshold (for all functions) is set to the Minimum of the input raster.
  • maximum (for TfLinear, TfLogisticDecay, TfLogisticGrowth, and TfSymmetricLinear) is set to the Maximum of the input raster.
  • meanMultiplier (for TfMSLarge and TfMSSmall) is 1.
  • midpoint (for TfGaussian and TfNear) is set to the midpoint of the value range of the input raster.
  • midpoint (for TfLarge and TfSmall) is set to the mean of the input raster.
  • minimum (for TfLinear, TfLogisticDecay, TfLogisticGrowth, and TfSymmetricLinear) is set to the Minimum of the input raster.
  • shift (for TfExponential, TfLogarithm, and TfPower) is derived from the input raster.
  • spread (for TfGaussian and TfNear) is derived from the input raster.
  • spread (for TfLarge and TfSmall) is 5.
  • STDMultiplier (for TfMSLarge and TFMSSmall) is 1.
  • upperThreshold (for all functions) is set to the Maximum of the input raster.
  • valueAboveThreshold (for all functions) is set to the to_scale value.
  • valueBelowThreshold (for all functions) is set to the from_scale value.
  • yInterceptPercent (for TfLogisticDecay) is 99.0000.
  • yInterceptPercent (for TfLogisticGrowth) is 1.0000.

Transformation function
from_scale
(Optional)

The starting value of the output evaluation scale.

The from_scale value cannot be equal to the to_scale value. The from_scale can be lower or higher than the to_scale (for example, from 1 to 10, or from 10 to 1).

The value must be positive and it can be either an integer or double.

The default is 1.

Double
to_scale
(Optional)

The ending value of the output evaluation scale.

The to_scale value cannot be equal to the from_scale value. The to_scale can be lower or higher than the from_scale (for example, from 1 to 10, or from 10 to 1).

The value must be positive and it can be either an integer or double.

The default is 10.

Double

Return Value

NameExplanationData Type
out_raster

The output rescaled raster.

The output will be a floating-point raster with values ranging from (or within) the from_scale and the to_scale evaluation values.

Raster

Code sample

RescaleByFunction example 1 (Python window)

This example creates a raster whose values are rescaled using the MSSmall function.

import arcpy
from arcpy.sa import *
from arcpy import env
env.workspace = "c:/sapyexamples/data"
outRescale = RescaleByFunction("elevation", TfMSSmall(1.25, 1.5, "#", "#", 4000, "NoData"), 1, 10)
outRescale.save("c:/sapyexamples/rescaletfms1")
RescaleByFunction example 2 (stand-alone script)

Demonstrates the use of this tool on elevation data, where locations with lower elevations are much more preferred than higher elevations. Locations above 4,000 meters are set to NoData.

# Name: TfMSSmall_Ex_02.py
# Description: Rescales input raster data using a MSSmall function and
#     transforms the function values onto a specified evaluation scale. 
# Requirements: Spatial Analyst Extension
# Author: esri

# Import system modules
import arcpy
from arcpy import env
from arcpy.sa import *

# Set environment settings
env.workspace = "C:/sapyexamples/data"

# Set local variables
inRaster = "elevation"

# Create the TfMSSmall object
meanmult = 1.25
stdmult = 1.5
lowerthresh = "#"
valbelowthresh = "10"
upperthresh = 4000
valabovethresh = "NoData"
myTfFunction = TfMSSmall(meanmult, stdmult, lowerthresh, valbelowthresh, upperthresh, valabovethresh)

# Set evaluation scale
fromscale = 1
toscale = 10

# Execute RescaleByFunction
outRescale = RescaleByFunction(inRaster, myTfFunction, fromscale, toscale)

# Save the output
outRescale.save("c:/sapyexamples/rescaletfms2")