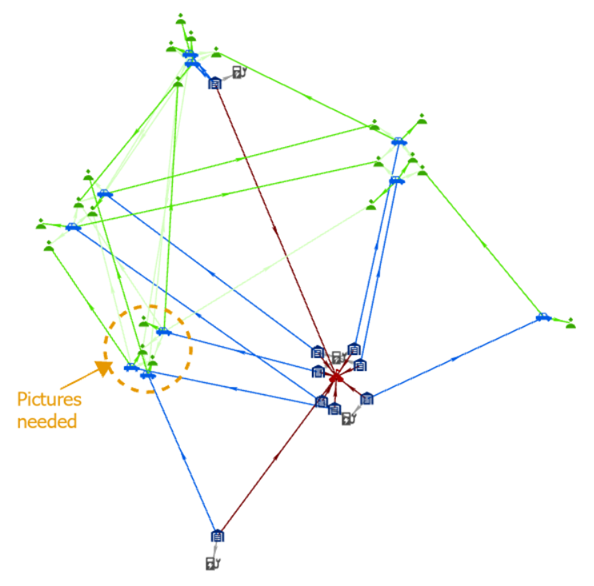
As you build a link chart from a knowledge graph, you can change how entities are arranged to better visualize the relationships between them. You can select individual entities and move them. You can also change the layout that is used to arrange entities on the link chart and draw the relationships between them.
By default, entities are arranged using the standard organic layout. However, several types of layouts are available to choose from: basic, organic, tree, radial, and hierarchical. The layout used to arrange the contents of a link chart is indicated on the ribbon and is referred to as the current layout. Various operations that act on this link chart will use the current layout to process results. For example, when you add entities and their relationships, they are added in a manner that is appropriate for the current layout.
If a specific portion of a link chart isn't well-represented by the current layout, you can select those graph items and apply a different layout to the selected content.
Basic layouts
This group only includes the grid layout  at this time. This layout arranges entities in a regularly spaced lattice pattern, where the size of the grid depends of the number of entities.
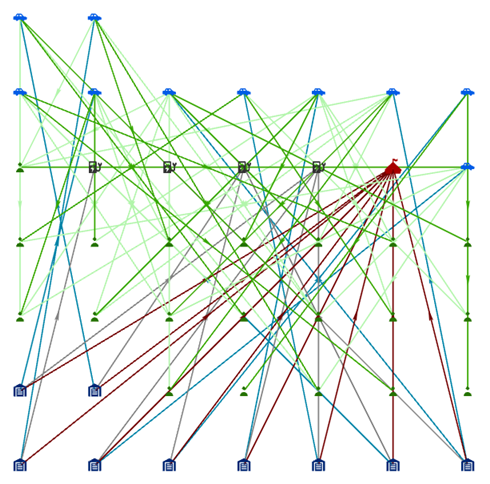
Organic layouts
In this group, entities are arranged on the link chart using force-directed layouts. This type of layout algorithm considers the link chart as if it were a mechanical system. The entities repel each other like two magnets aligned with the same poles facing each other, while they are attracted to each other by the relationships that join entities together. The algorithm iteratively reviews and places entities and evaluates the forces until equilibrium is reached. These layouts allow you to visualize entities in clusters that emphasize how they are connected.
The supported organic layouts are: standard, community, leaf circle, fusiform, and geographic.
Standard organic layout
The standard layout  uses a force-directed layout to arrange the entities.
The standard layout is the default layout used to arrange entities and relationships when a link chart is created.
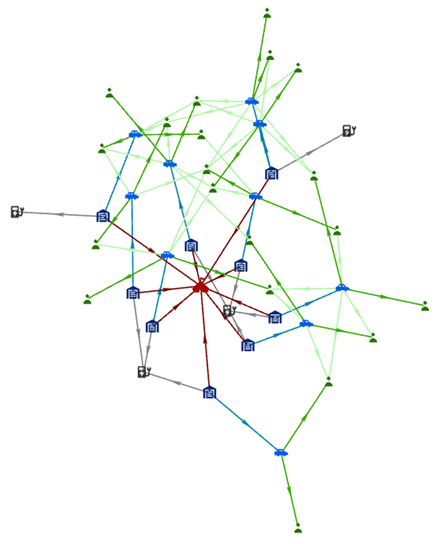
Community organic layout
The community layout  finds communities, which are groups of entities that are closely related to each other. A force-directed layout is then used to arrange the communities. The attraction forces along relationships between entities of different communities are relaxed so that different communities are more spread out than with the standard organic layout.
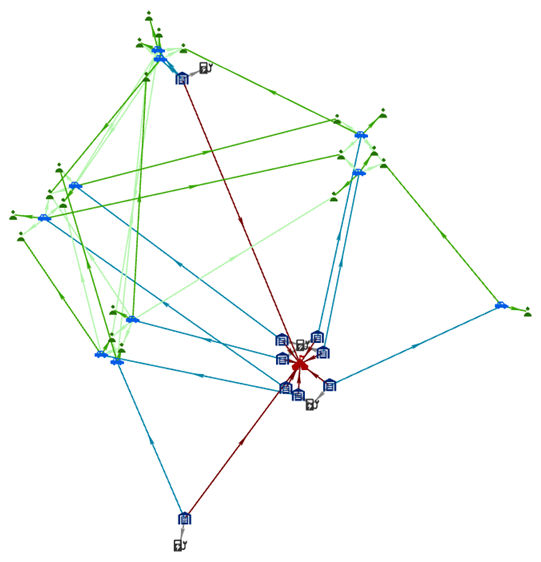
Leaf circle organic layout
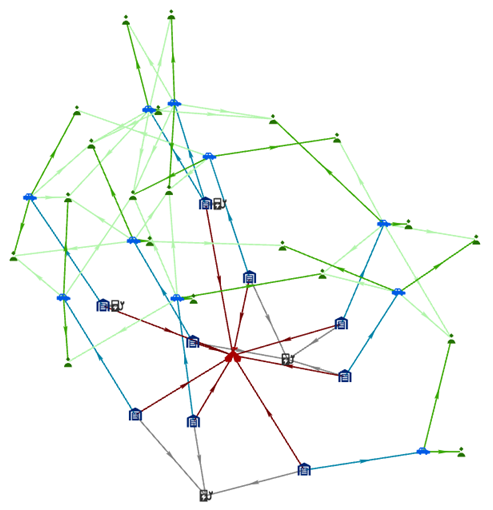
The leaf circle layout  uses the same force-directed layout as the standard layout. However, the leaf entities are arranged in circles around the entities to which they are connected. This structure allows you to visualize which entities are peripheral to the network.
Fusiform organic layout
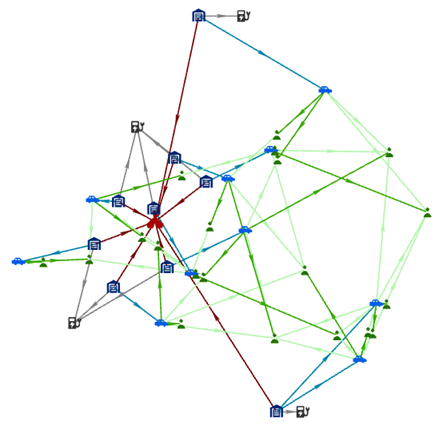
The fusiform layout  is similar to the leaf circle layout. However, entities with a reduced degree of two or three are handled differently.
A group of entities with a reduced degree of two that are associated with the same two entities are excluded from the force-directed layout process at the beginning. At the end, the group of entities are placed along a line. The line is orthogonal to a line drawn between the two entities to which they are connected. For example, suppose two parents stand separated from each other on a path. A line can be drawn between the two parents along the sidewalk. Their children would stand next to each other along a line drawn orthogonal to the line that connects the parents.
Entities with a reduced degree of three are handled in a similar manner. However, they are positioned around the center of mass between the connected entities. This layout allows you to see that several entities have relationships with same pair or trio of entities.
Geographic organic layout
The geographic layout  arranges spatial
entities geographically using their geometry. Spatial entities where the entity has a null
geometry and nonspatial entities are also displayed on the link chart, but their placement and arrangement are determined using the standard
layout.
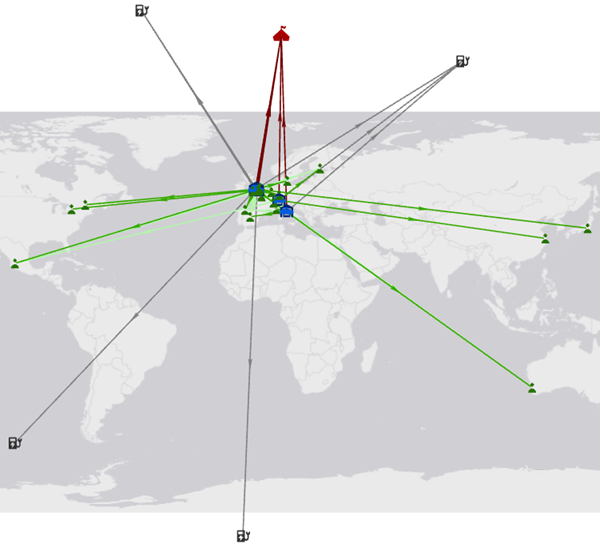
The Light Gray Canvas basemap is used by default as a backdrop to provide spatial context. To change the basemap, click the Basemap gallery  in the Layer group on the Link Chart tab on the ribbon.
You can also add spatial data to link charts that use the geographic layout. On the Link Chart tab, in the Layer group, click Add Data  .
.
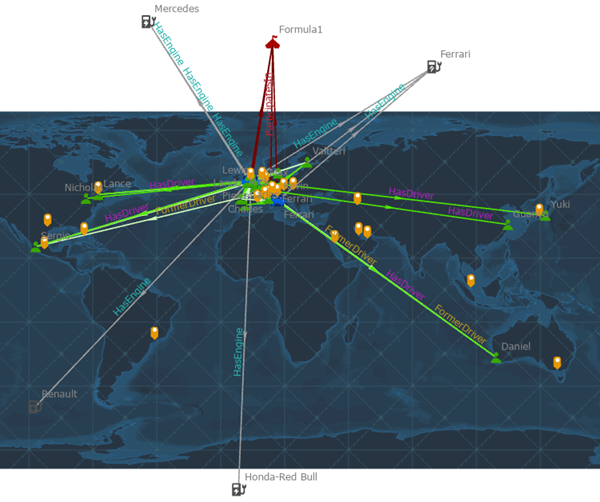
If you change the link chart to use a different layout instead, the basemap and any added spatial data are removed.
Tree layouts
A tree layout arranges entities and their relationships as in nature, where the tree starts from the trunk and all branches move out from that point. In the link chart, the root entity is the starting point, positioned at the top for a top to bottom layout. The entities related to the root entity are then lined up in a row below the root entity, from left to right in this example. Any entities related to those items that aren't already present in the link chart are added as another row closer to the bottom, and so on.
You can designate one or more entities in the link chart as the root entities. If a root entity isn't specified, the algorithm identifies the entity associated with the smallest network topology index and uses it as the root entity.
The tree layout types represent the different directions in which relationships can be oriented. The types are as follows: left to right, right to left, top to bottom, and bottom to top.
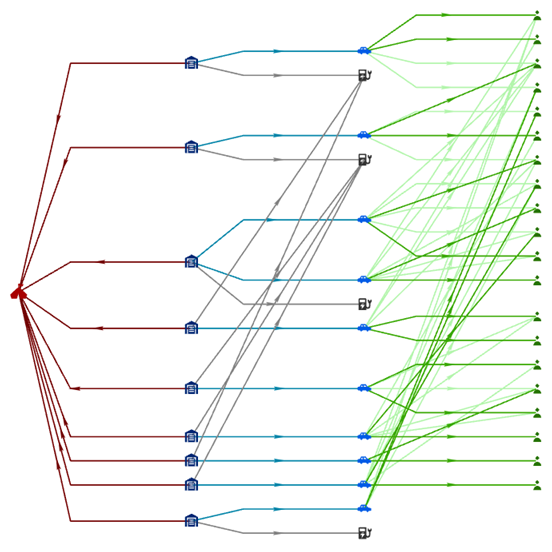
Left to right tree layout
The left to right layout  positions the root entity on the left of the link chart. Each level in the tree is positioned closer to the right of the link chart.
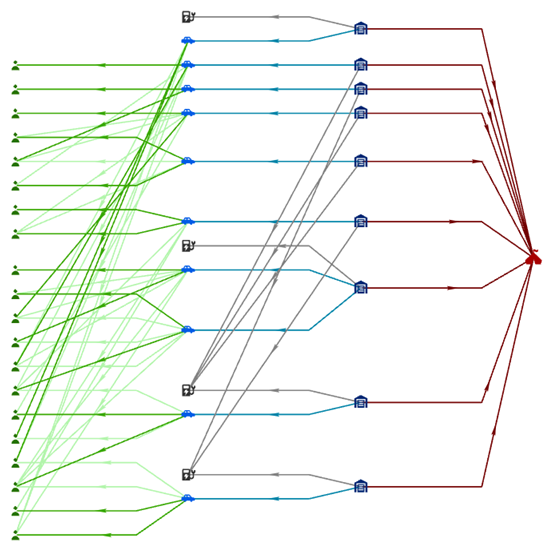
Right to left tree layout
The right to left layout  positions the root entity on the right of the link chart. Each level in the tree is positioned closer to the left of the link chart.
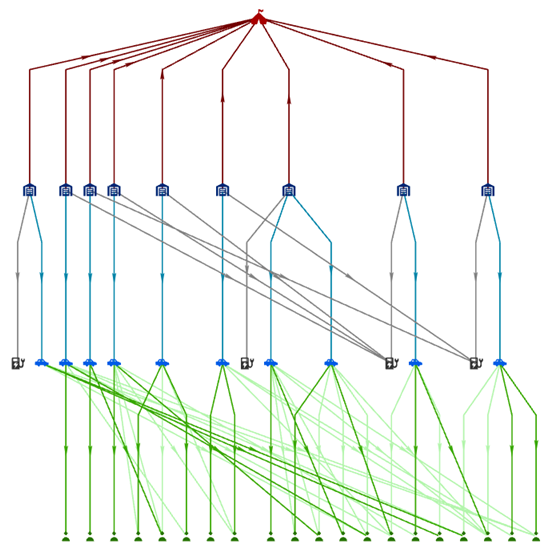
Top to bottom tree layout
The top to bottom layout  positions the root entity at the top of the link chart. Each level in the tree is positioned closer to the bottom of the link chart.
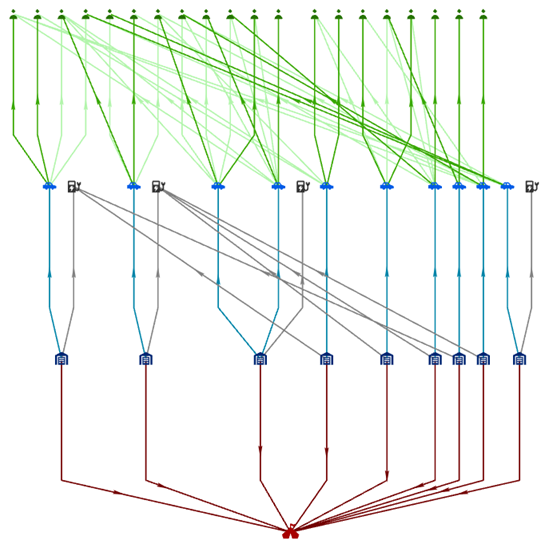
Bottom to top tree layout
The bottom to top layout  positions the root entity at the bottom of the link chart. Each level in the tree is positioned closer to the top of the link chart.
Radial layouts
Radial layouts are a particular form of tree layout where the root of the tree is placed in the center of a circle and the entities to which it is related are positioned in a circle around the root. The supported radial layouts are root-centric and node-centric.
Root-centric radial layout
The root-centric layout  places the root entity for the tree in the center of a circle. All leaf entities for the tree are positioned around the outer edge of the circle. Entities at each level of hierarchy in the tree are arranged in concentric circles between the root entity and the outer circle.
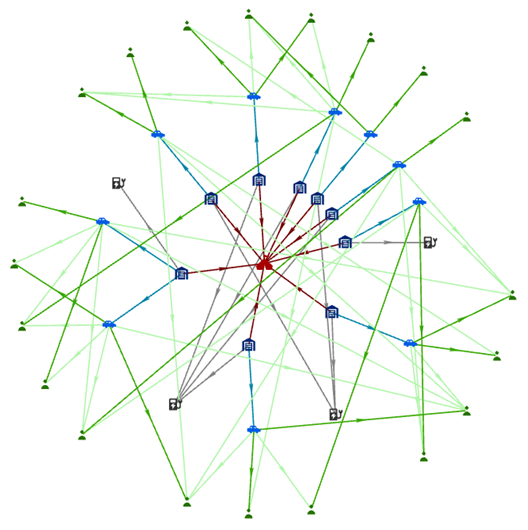
Node-centric radial layout
The node-centric layout  is also based on circles. Each entity is used as the center of a circle and the entities to which it is related are placed around the edge of that circle. Entity circles can overlap, as entity circles are placed around the root of the tree.
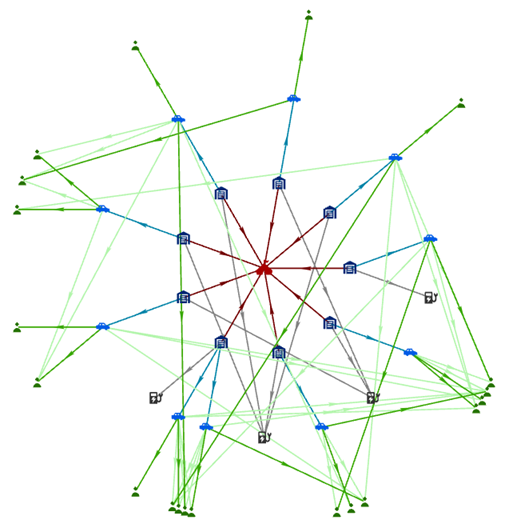
Hierarchical layouts
The hierarchical layouts are arranged similarly to tree layouts. However, an attempt is made to orient the majority of the relationships in the specified direction. For example, in a top to bottom hierarchical layout, origin entities for the relationship are positioned at the top and destination entities are positioned at the bottom.
The algorithm will attempt to limit the number of places in which the lines representing relationships cross each other. In contrast with tree layouts, relationships are not allowed between entities at the same level in the chart with hierarchical layouts.
The supported hierarchical layouts are top to bottom and bottom to top.
Top to bottom hierarchical layout
The top to bottom layout  positions the root entity at the top of the link chart. The algorithm attempts to place origin entities toward the top and destination entities toward the bottom of the link chart.
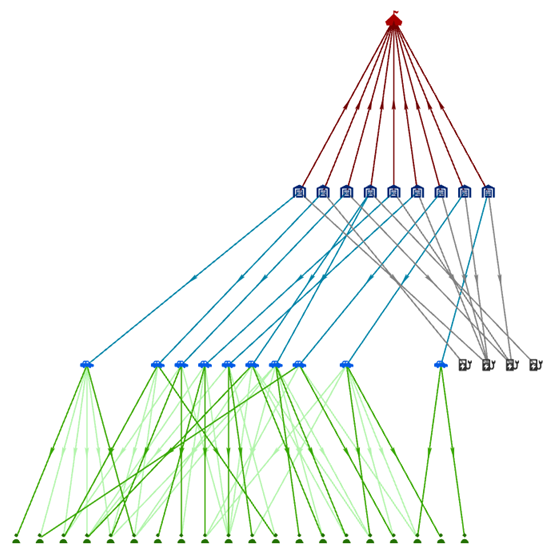
Bottom to top hierarchical layout
The bottom to top layout  positions the root entity at the bottom of the link chart. The algorithm attempts to place origin entities toward the top and destination entities toward the bottom of the link chart.
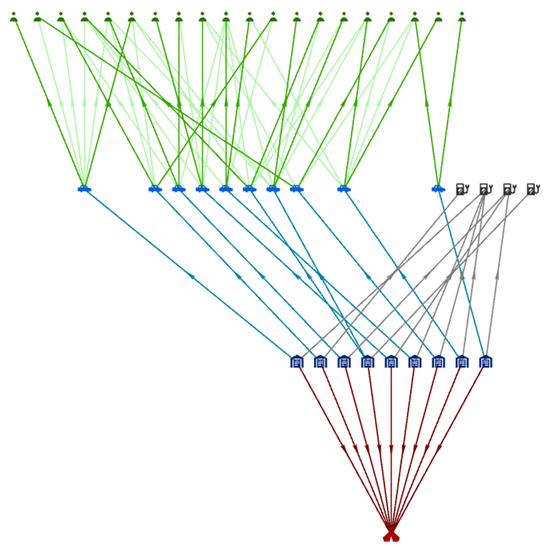
Change the current layout for a link chart
A link chart's current layout appears on the Link Chart tab on the ribbon in the Layout group. For example, if the link chart is currently using the default standard organic layout, the icon for the standard layout  appears on the drop-down list.
Follow the steps below to apply a different layout to the entities and relationships in a link chart.
- Click the Link Chart tab on the ribbon.
- To change the layout for the entire link chart, click Clear in the Selection group.
- In the Layout group on the ribbon, click the Layout drop-down list and click a different layout on the gallery.
All entities and relationships on the link chart are rearranged according to the new layout. The icon for the new layout appears on the drop-down list on the ribbon and is now the current layout for the link chart.
- To change the layout for a subset of graph items on the link chart, select the appropriate entities and relationships.
- In the Layout group on the ribbon, click the Layout drop-down list and click a different layout on the gallery.
The selected entities and relationships only are rearranged according to the new layout. The icon for the new layout appears on the drop-down list on the ribbon and is now the current layout for the link chart.
Set the root entity for tree, radial, and hierarchical layouts
When you use a tree, radial, or hierarchical layout in a link chart, you can optionally choose a specific entity and use it as the root of the tree. You can select more than one root entity, but this is only meaningful when there are disjoined sets of content on the link chart that form more than one tree.
Three buttons are available on the ribbon in the Layout group that allow you to set and visualize the root entity in the link chart.
- Show Roots—This toggle button allows you to see which entities in the link chart are set as the root entities for tree, radial, and hierarchical layouts. The root entities are highlighted with a green diamond on the link chart when the toggle button is on. Show Roots is on by default.
- Set Roots—If one or more entities are selected in the link chart, you can set them to be the root entities with this button.
- Select Roots—Use this option to interactively select the entity you want to set as the root entity. Any graph items that are currently selected in the link chart are cleared. Click an entity or draw a shape with the current selection tool to select the appropriate entities.
With this mode turned on for the active link chart, a green diamond symbol overlays each link chart entity currently set as a root. Also, the overlaying green diamond symbol automatically appears or disappears at the top of each entity you are adding to or removing from the set of currently specified root entities.
Set the root entity following the steps below.
- Click the Link Chart tab on the ribbon.
- If the Show Roots toggle button
 is not highlighted in the Layout group on the ribbon, click the toggle button.
When the Show Roots toggle button is on, the root entities in the link chart are highlighted with a green diamond. If no entities are highlighted in this manner, the root entities for the link chart have not been set.
- Select one or more entities on the link chart to use as the root entities.
- In the Layout group, click Set Roots
 .
.A green diamond symbol appears over each selected entity to indicate it has been set as a root entity. The root entities remain selected in the link chart.
- To change the root entities, click Select Roots
 .
.Any currently selected entities and relationships are deselected, and the root entities are selected.
- Select entities to use as the root entities.
- Click Set Roots
 .
.The green diamond symbol is removed from the previous set of root entities and appears over the currently selected entities in the link chart to indicate they are now root entities. The root entities remain selected in the link chart.
- To clear all root entities, click Clear in the Selection group on the ribbon, and click Set Roots
 .
.All the green diamond symbols are removed from the link chart because there are currently no root entities in the link chart.
Tip:
After applying a layout to the entities in a link chart, you may realize there is a second disjoined tree present. To add another root entity for the second tree, the current root entity must be selected and you must also select another entity. Press Shift and click both entities, and click Set Roots.
Move entities and relationships
You can select entities and relationships interactively and move them to another position on a link chart using one of the available selection options.
In general, you can select entities and relationships on the link chart in the same way you select features on a map or select features using attributes. Use the selection tools available on the ribbon to determine how you want to interactively select entities and relationships, such as using the default rectangle selection tool.
At the bottom of the list, you can choose either to only select entities and relationships or to select and move them to a new position.
- Select is checked—Select entities and relationships. For example, you can remove the selected graph items from the link chart. You can't interactively move the selected graph items.
- Select and Move is checked—Select entities and relationships and move them to another position. The moved entities remain connected to other entities in the link chart that were not selected. The entities connecting the moved items to the rest of the link chart are stretched.
Follow the steps below to select and move entities and relationships in a link chart.
- On the Link Chart tab on the ribbon, in the Selection group, click the Select drop-down list.
- Click the selection tool you want to use at the top of the list, such as the Rectangle selection tool.
- Check Select and Move at the bottom of the list.
The active selection mode is checked and the drop-down list indicates you are using the Select and Move tool
 .
. - Hover over an unselected entity in the link chart.
An orange circle appears over the entity that will be moved.
- Drag the entity to a new location on the link chart.
As you move the entity, any relationships to which it is connected are highlighted in orange. You can only move unselected entities individually.
The entity is in its new position, and lines representing the relationships in which the entity participates are shrunk or stretched to accommodate its new location.
- Interactively select entities and relationships on the link chart that you want to move.
- Hover over a selected entity in the link chart.
An orange circle appears over any selected entities that can be used as an anchor point to move the selected graph items. Selected relationships are also highlighted in orange.
- Drag the highlighted orange graph items to a new location on the link chart.
All selected graph items are moved together. Their current position with respect to each other is maintained in the new location.
The graph items are in their new position. Lines representing the relationships that connect the selected entities to the rest of the link chart are shrunk or stretched to accommodate the new location.
Change organic layout settings
If you use organic layouts, a few settings allow you to adjust how entities and relationships are positioned on a link chart. When ArcGIS AllSource calculates where to place entities and relationships on the link chart, performance is optimized to get a good result in a reasonable amount of time. However, if you are willing to wait longer with large knowledge graphs, additional calculations can be made that can improve the overall results. Use the Computation Budget setting to indicate the maximum amount of time that can be spent performing the calculations.
As discussed above for organic layouts, entities repel each other but are also attracted to each other by their relationships. By default, the repulsion radius used in organic layouts is calculated automatically based on the data in your graph. However, you can manually adjust the Repulsion Radius setting to get a different result. For example, with a community layout, if you increase the radius size, communities not tightly connected are positioned farther apart on the link chart. In other cases, if an organic layout evenly distributes a specific set of data in a circular pattern, for example, increasing the repulsion radius may not have a noticeable effect because the forces between the entities are well-balanced.
With a geographic layout, entities with spatial locations are fixed in their geographic position on the map. Entities without spatial locations are arranged using the standard layout. You can influence how these entities are arranged by modifying the Ideal Edge Length setting. By increasing the edge length, related entities without a spatial location are positioned farther away from those with a spatial location. Different lengths may be appropriate for maps of different scales.
Two methods can be used to calculate the distance between a spatial entity and a related nonspatial entity. The Multiplicative setting is used by default, where the distance that would typically be used on a link chart is multiplied by the given amount. The Absolute setting takes the degree of the nonspatial entity in the network represented on the link chart and multiplies it by the given value. By default, the map will zoom in or out as you adjust the settings; you will always see all entities on the link chart. Check the Keep current extent option to change the placement of the nonspatial entities without changing the map's scale.
Follow these steps to change organic layout settings.
- Ensure the current layout for the link chart is an organic layout.
- On the Link Chart tab on the ribbon, in the Layout group, click the Settings button
 .
. - Change the Computation Budget setting using one of the following methods:
- Drag the slide control left or right.
- Type a number into the text box.
By default, a maximum of two seconds are allowed to complete the appropriate calculations. The minimum value is one second and the maximum value is 100 seconds.
- Click the Auto toggle button to turn off automatic calculations for the Repulsion Radius setting and change how the radius is calculated using one of the following methods:
- Drag the slide control left or right.
- Type a number into the text box.
By default, a repulsion radius of one is used. The minimum value is one and the maximum value is 99.
- If the current layout for the link chart is geographic, click the Ideal Edge Length drop-down list, click the appropriate method for calculating the distance, and use one of the methods below to change how the distance is calculated.
- Drag the slide control left or right.
- Type a number into the text box.
For the Multiplicative method, a multiplier of one is used by default; the minimum value is zero and the maximum value is five. For the Absolute method, a multiplier of one is used by default; the minimum value is one and the maximum value is 360.
- If the current layout for the link chart is geographic, check Keep current extent to keep the same map scale as you change the layout settings.
- Click Apply.
The entities are repositioned on the link chart according to the current settings.
Note:
To return the layout settings to their default values, click the Settings button  , click Reset, and click Apply. Clicking Reset will not change your choice with respect to maintaining the current extent of the map when you use a geographic layout.
Increase or decrease text and symbol sizes in a link chart
You can fine-tune how entities and relationships and their labels are symbolized on the link chart using the buttons available. Follow the steps below to increase or decrease symbol or labels for layers in the link chart.
- In the Contents pane, select the layers whose symbols you want to adjust using one of the following options.
- To modify symbols for all layers in the link chart, select the knowledge graph layer or clear all selected layers.
- Select the link chart layer for a specific entity type or relationship type to modify its symbols. The change will only affect how ungrouped entities and relationships are visualized.
- Select the link chart aggregation layer for a specific entity type or relationship type to modify its symbols. The change will only affect how grouped entities and relationships are visualized.
- On the Link Chart tab on the ribbon, in the Layout group, click any of the buttons listed below to adjust the symbols for the selected layers.
- To increase the size of an entity's point symbol and the width of a relationship's line symbol, click Increase Symbol
 .
. - To decrease the size of an entity's point symbol and the width of a relationship's line symbol, click Decrease Symbol
 .
. - To increase the font size for entity and relationship labels, click Increase Label
 .
. - To decrease the font size for entity and relationship labels, click Decrease Label
 .
.
- To increase the size of an entity's point symbol and the width of a relationship's line symbol, click Increase Symbol
Point symbols for the selected layers are modified on the link chart. Save your project to save your changes.
Add graphics to a link chart
As you build and arrange the entities and relationships on your link chart, you may discover aspects of the data or items of interest that require further investigation. You can use graphics layers on your link chart to add shapes, text, and pictures that call attention to a group of entities, a relationship, or add notes for future work.
- On the Link Chart tab, in the Layer group, click Add Graphics Layer
 .
.A new graphics layer appears in the Contents pane.
- After the graphics layer is created, click the Graphics tab. In the Insert group, use the gallery to insert new graphic elements.
