The void analysis workflow analyzes a selected area (the analysis area) to detect voids and gaps in specific businesses and services compared to another area (the reference area).
Example
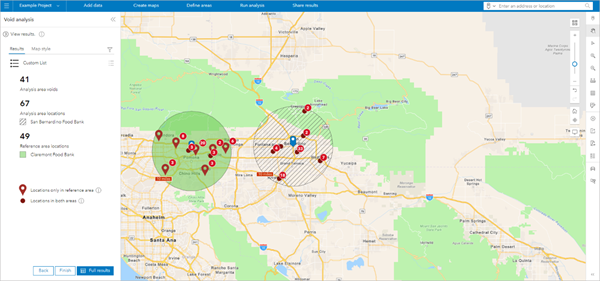
A nonprofit wants to determine whether there is a gap in food bank services in one area compared to another area where the food bank system is working well. By creating a reference area in the region where the food bank system is working and an analysis area around the proposed new site, the nonprofit can assess the gap between the two areas.
Usage notes
The reference area, by default, is set as two times the size of the analysis area.
Choose from the following options:
- Expand the analysis area by a factor—The area is expanded by a factor you provide. The default factor is 2. For analysis areas that are point location sites, the radius is multiplied by the factor. For example, a 5-mile ring around a point location is expanded with a 10-mile ring. For analysis areas that are polygons or standard geographies, the area is expanded by the factor size. For example, a polygon expanded by a factor of 2 is expanded with a buffer that increases the area to approximately twice the original size.
- Expand the analysis area by a fixed distance or time—The area's units (miles, kilometers, or minutes) are expanded by a value you provide. The default is 5.
- Use the nearest standard geography—Use the drop-down menu to choose a geography level. The workflow adds the chosen geography that intersects the analysis area.
- Select area manually—Use the Select reference area window to choose a second site as the reference area.
Results
The Void analysis workflow pane displays the results of the analysis. You can also view more detailed analysis results in the expanded full results table and its advanced view.
To set preferences, such as turning the intro page on or off, choosing your reference area setting, and setting your style options, see Perform a void analysis.
To filter the results in the workflow pane or results table, click Filter  . Use the following filtering options:
- Number of results—Choose Maximum results per category and provide the number of results to display.
- Filter by attributes—In the Basic option, choose a category from the Filter by category drop-down menu. In the Advanced option, choose an attribute from the Select attribute drop-down menu and specify the filter settings. For example, choosing Sales volume opens a slider showing the minimum and maximum values for sales volume. You can set multiple attribute filters.
- Filter by category—Use the drop-down menu to choose a category.
- Filter by difference type—Check the Show voids only check box to filter the results to voids only. This option is automatically enabled when viewing the full results table, which displays voids only.
Void analysis workflow pane
The Void analysis workflow pane displays the summarized results of the analysis. The results are displayed on the Results tab and are also represented as symbols on the map. The Map style tab contains options that allow you to style the analysis results on the map.
The workflow pane's Results tab contains the following information and options:
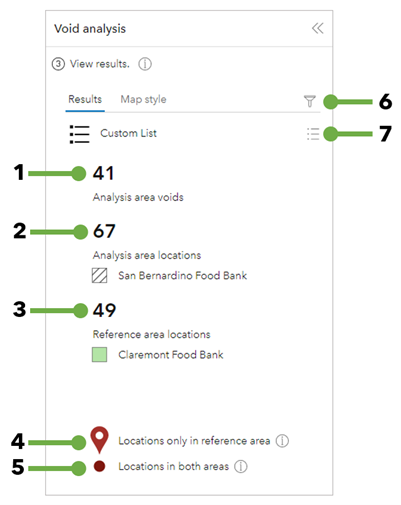
1 | Analysis area voids | This number represents businesses located in the reference area but not present in the analysis area. Results are calculated by subtracting the number of businesses in the reference area from the number of businesses in the analysis area. |
2 | Analysis area locations | This number represents the total number of businesses in the analysis area. |
3 | Reference area locations | This number represents the total number of businesses in the reference area. |
4 | Locations only in reference area | The business locations in the reference area that are not present in the analysis area. By default, these locations are symbolized on the map by a pin symbol. |
5 | Locations in both areas | The business locations in the reference area that are also present in the analysis area. By default, these locations are symbolized on the map by a point symbol. |
6 | Filter | Access the filter window containing options for viewing results by attribute, category, and difference type. |
7 | Show list | View the categories searched, data source, and the field used to determine voids. |
Full results table
In the Void analysis workflow pane, click Full results to view an expanded table containing detailed analysis results.
The full results table contains the following information and options:
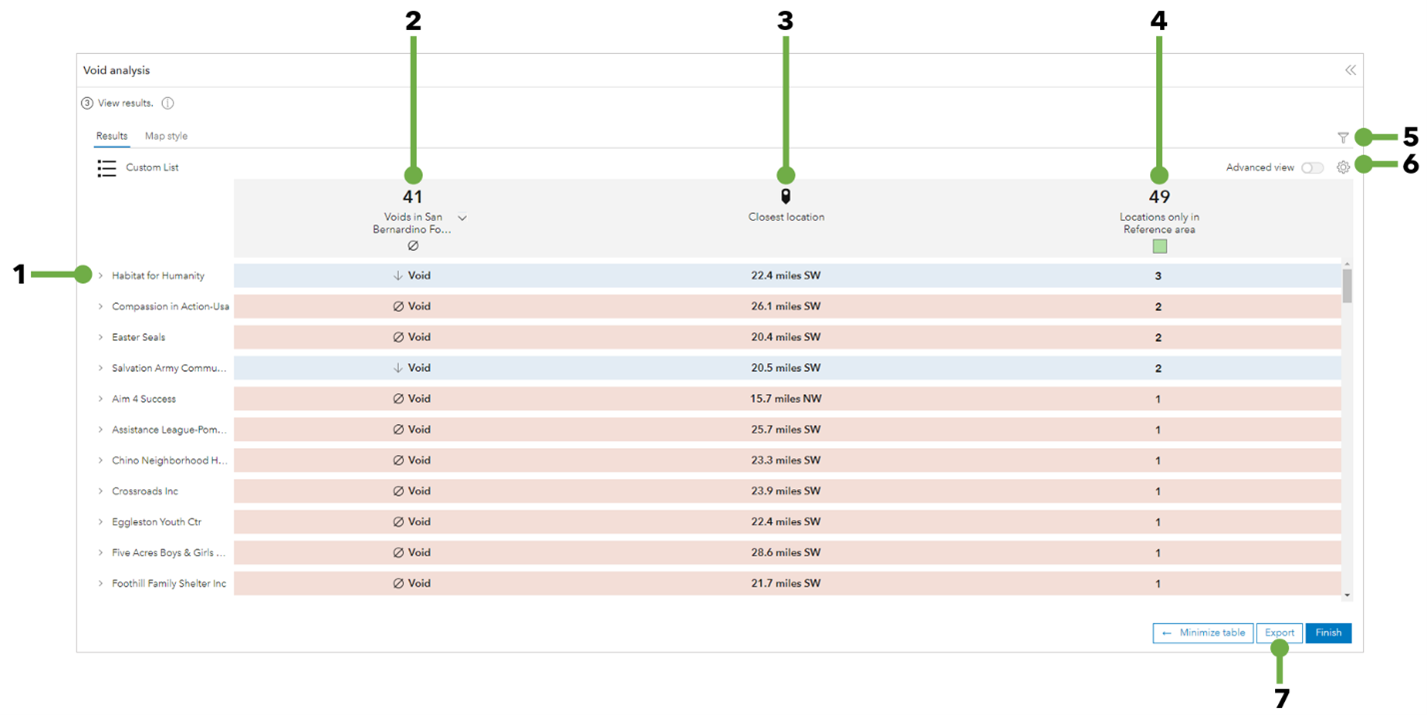
1 | Business or category name | Expand each entry to view additional business and location information. Click a row also to expand or collapse the entry. |
2 | Voids in the analysis area | Void symbols indicate a lack of this business in the analysis area. |
3 | Closest location | The distance from the business location in the reference area to the analysis area centroid. |
4 | Locations only in reference area | The number of business locations in the reference area. |
5 | Filter | Access the filter window containing options for viewing results by attribute, category, and difference type. |
6 | Table settings | Limit the results to show categories only, or hide categories with no locations. Change the colors representing gaps, voids, surpluses, and balanced values. |
7 | Export | Export the results in Excel or PDF. |
Full results: Advanced view
The advanced view of the results table provides further details of the analysis results. Turn on the Advanced view toggle button to open this view. For information about the calculations available in the advanced view, see Calculations.
The advanced view of the full results table contains the following information and options:
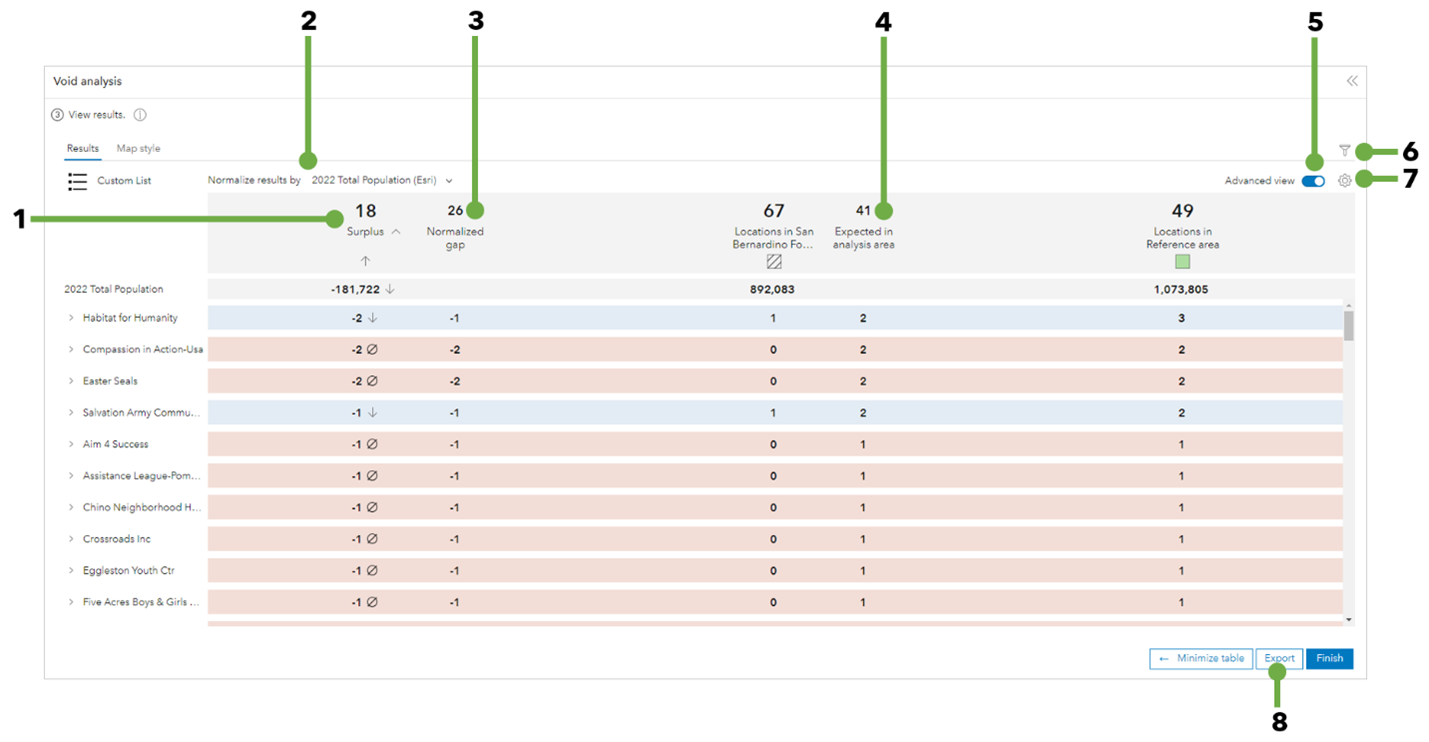
1 | Comparison indicator | The indicators are as follows:
|
2 | Normalize results by | Change the normalization variable. Choose one of the listed variables, or click Browse for a variable to choose another variable in the data browser. A normalization variable provides additional context to determine whether a true gap exists, or whether voids are present because the analysis area is smaller or has fewer people than the reference area. |
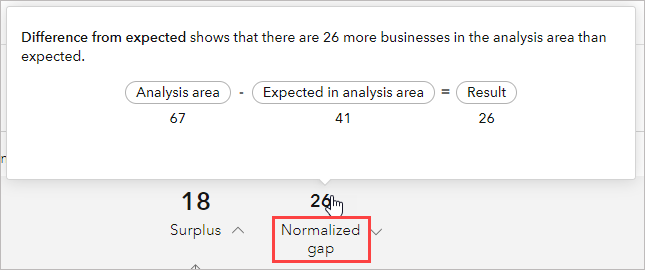
3 | Normalized gap | This number indicates the difference between the actual number of businesses in the analysis area and the number that is expected based on the normalization variable chosen, such as population. |
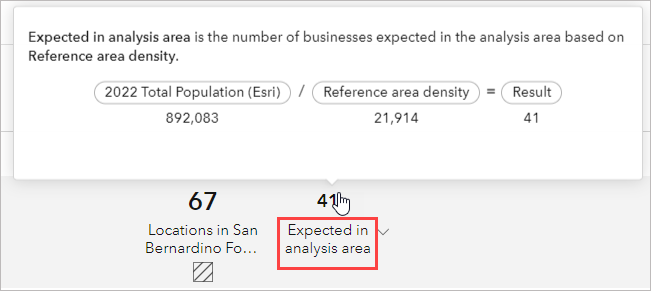
4 | Expected in analysis area | This number indicates the expected number of businesses based on the reference area density. |
5 | Advanced view | Switch between the full results table and the advanced view. |
6 | Filter | Access the filter window containing options for viewing results by attribute, category, and difference type |
7 | Table settings | Change the colors representing gaps, voids, surpluses, and balanced values. By default, values representing voids are indicated by rows shaded red. If you chose a normalization variable, you can add density columns to the table by checking the Display density column in advanced view check box. |
8 | Export | Export the results in Excel or PDF. |
Calculations
The advanced view of the full results table provides information about workflow calculations when you hover over result indicators.
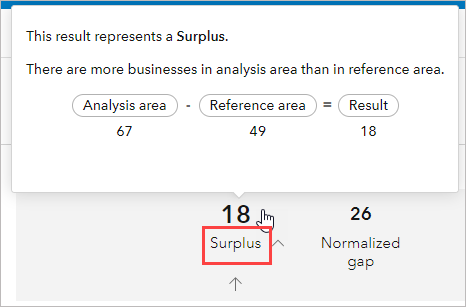
Comparison indicator
This number indicates gap, surplus, void, or balance between areas. The equation is as follows:
Number of businesses in analysis area - Number of businesses in reference area = Result
Normalized gap indicator
This number indicates the difference between the number of businesses in the analysis area and the number that is expected based on the normalization variable chosen, such as population. The equation is as follows:
Number of businesses in analysis area - Number of business expected in the analysis area = Result
Expected in analysis area indicator
This number indicates the expected number of businesses based on the reference area density. The equation is as follows:
Normalization variable for reference area / Reference area density = Result
Limitations
There is a limit of 5,000 returned points of interest. When the reference area reaches this maximum, it stops adding points.
Credits
This workflow consumes credits. Credit estimates are as follows:
- Export results to PDF—10 credits
- Export to PDF with the Include individual business locations check box checked—10 credits per 1,000 records
See Credits for more information about credit consumption in ArcGIS Community Analyst.
Resources
See Perform a void analysis to learn more.
 . For
example, a gap value of -12 represents a total gap—that is, the
total number of businesses in the analysis area is less than in the
reference area.
 .
. .
.