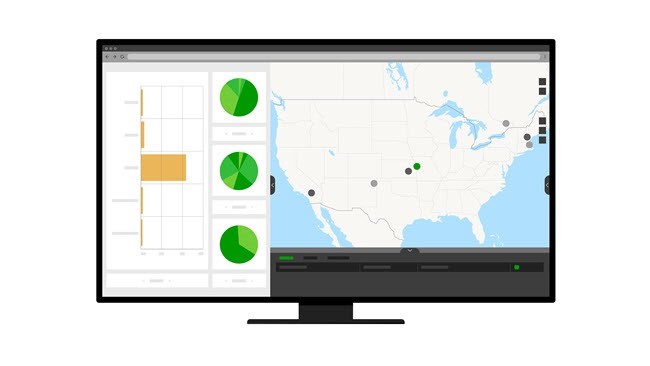
The Dashboard contains charts that provide information on issues and document status, the types of issues in the document, what caused the issue, and the organization that created the issue. The following are the capabilities of the Dashboard widget:
- You can click the chart's panel or click the individual chart elements on the Dashboard to make the features associated with the charts flash on the map.
- The features in the navigation arrows represent the number of Issues (as features) returned against the applied filter (selection by clicking in the corresponding chart). Using those navigation arrows do not trigger any events, queries, or filters in the Dashboard or GeoBIM.
Note:
The minimum vertical resolution required for the Dashboard widget is 668. If it is less than that, the dashboard interaction with the map no longer works.