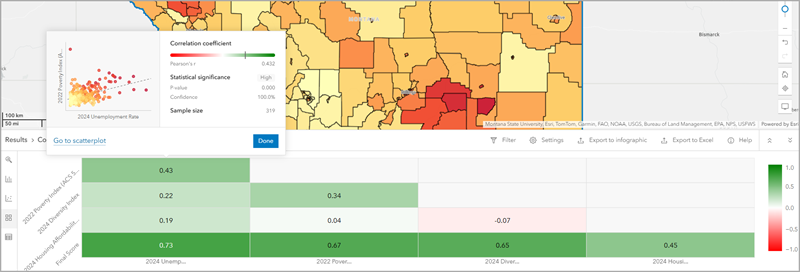
In suitability analysis, you can use the correlation matrix tool to evaluate how your variables correlate to one another and the final score. This analysis identifies multicollinearity (overlapping or redundant variables), which supports better variable selection, more thoughtful weighting decisions, and a stronger suitability index design.
Suitability analyses often include variables that measure similar concepts. If you don't check for overlap, you may double-count a concept and skew the results.
Example
A government agency is using suitability analysis to identify potential sites for a pop-up food bank. In the analysis, they included both poverty rate and unemployment rate as variables. Using the correlation matrix, it is clear that there is a high correlation between poverty rate and unemployment rate. Without adjustment, the analysis may overweight economic disadvantage. It is recommended that the analysts consider removing one variable from the redundant pair, merging related variables into a subindex, or adjusting their weights so the concept isn't counted twice.

Results
The correlation matrix analyzes the results from a suitability analysis to validate your variable choices. For example, you can spot multicollinearity and balance index influence. Using this knowledge, you can improve the strength of your suitability analysis.
To validate your variable choices using the correlation matrix, do the following:
- Spot multicollinearity. Multicollinearity occurs when two or more variables are so highly correlated that they capture the same information, making it hard to distinguish each variable's individual effect. Check variable pairs with high correlation (for example, Pearson's r > 0.75). To reduce multicollinearity, you can consider the following solutions:
- Removing one variable from a highly correlated pair
- Merging correlated variables into a subindex (for example, economic vulnerability or health access)
- Adjusting weights to mitigate the effect of highly correlated variables, so the same underlying concept isn't counted twice
Note:
Always apply domain knowledge when modifying weights.
Balance index influence. Flag any variable that is strongly correlated with the final score (for example, Pearson's r > 0.85). Adjust its weight or group it with related variables in a subindex so no single factor dominates the model. See Creating Composite Indices Using ArcGIS for detailed guidance on building subindices.
Calculations
Suitability analysis performs calculations using selected variables; it often includes variables that are conceptually or statistically similar. Without checking for overlap, you might unintentionally include multiple variables representing the same underlying concept—leading to biased or skewed results.
Correlation coefficient
Pearson's r is a coefficient ranging between -1 and 1 that measures both the strength and direction of a linear relationship. For example, values closer to +1 indicate a strong positive relationship whereas values closer to -1 indicate a strong negative relationship. Values close to 0 indicate little or no linear relationship. In the correlation matrix, you can filter the visualization based on the Pearson's r value.
Statistical significance
Statistical significance tells you whether a correlation is likely to be real—not just due to chance. Lower p-values (for example, p < 0.01) indicate a more statistically reliable relationship, meaning the correlation is less likely due to chance. In most cases, a p-value below 0.05 is considered statistically significant. A p-value of .05 corresponds to a 95 percent confidence level and is a common threshold for determining statistical significance.
In the correlation matrix, you can filter the visualization based on the statistical significance of variables. Asterisks are used to represent statistical significance as follows:
| Asterisks | p-value | Statistical significance |
|---|---|---|
*** | p < 0.001 | Highly significant |
** | p < 0.01 | Moderately significant |
* | p < 0.05 | Significant |
None | None | Not statistically significant |
Limitations
The correlation matrix is only available in the suitability analysis workflow.
Credits
This workflow consumes credits. Exporting results to Excel costs an estimate of 10 credits per 1,000 records.
See Credits for full information about credit consumption in Business Analyst Web App.
Licensing requirements
The suitability analysis workflow is available to users with a Business Analyst Web App Advanced license. To learn more about Business Analyst license types, see Licenses.
Resources
To learn more about suitability analysis, see the following resources: