In the Suitability Modeler, use the Evaluate tab to determine the quality of the model by exploring the interactions of the model criteria, the weights and transformations applied, and the final resulting maps. In conjunction with the Evaluate Pane and maps, the Evaluate tab provides an integrated, interactive environment with which to explore your model.
Interactions
As you investigate the interactions within the model, the maps, panes, plots, and contents dynamically update. This provides immediate feedback so you can better understand your model. With this understanding, you can justify each decision you make, giving you more confidence in the results.
With the Evaluate tab, you can explore the composition of the weighted transformed criteria values at locations that have equally high suitability so you can make better choices between them.
See Evaluate environment in Suitability Modeler and Evaluate workflow and suitability modeling constraints to gain insight into the guiding principles underlying the evaluation process.
Select the map type
On the Evaluate tab, select which map type to investigate, the Suitability map or the Locate map.
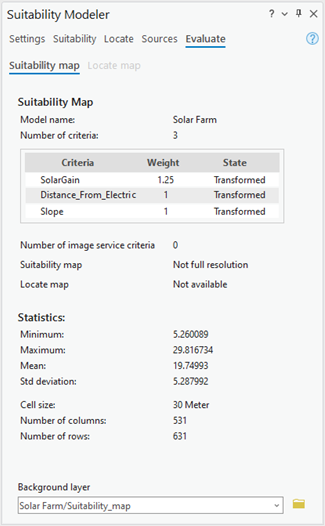
When Suitability map is selected, the tab displays the input model criteria, whether the criteria are transformed, if the suitability or locate maps are run at full resolution, and the statistics of the suitability map.
To select the Locate map option, the suitability map must be run at full resolution and the locate map created. When the Locate map is selected on the Evaluate tab, a plot of the resulting regions and the statistics of the regions are displayed.
When either the Suitability map or Locate map is selected, you can specify the layer that will be used as the background layer.

Evaluate Pane
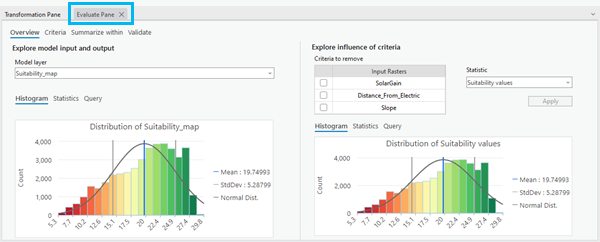
The Evaluate Pane and associated maps appear when you first click the Evaluate tab or when you click the Open Evaluate Pane button  in the Evaluate Model group on the Suitability Modeler ribbon. Use the Evaluate Pane to apply various statistics to the suitability values and the individual base and weighted transformed criteria values so that you can explore the model interactions.

Statistics
In the Evaluate Pane, as each statistic is applied, the following actions occur:
- A map of the selected statistic is displayed in the appropriate map.
- The Contents list for that map is updated with a layer named for the statistic.
- A plot based on the selected statistic appears. The types of plots include histogram, scatter plot, bar chart, or box plot.
- The statistics of the output layer are updated.
Background layer
The background layer identified on the Evaluate tab provides a context for the analysis. The layer is also used for the Swipe tool  . With swipe, you can examine the resulting map from the selected statistic relative to the suitability values.
Refine the model
There is synergy between Evaluate and the model creation environments. When exploring in the Evaluate environment, you can refine the model, which is useful when using observation data. You can change the transformations or weights in the model, and those changes are dynamically updated in the Evaluate environment so you can immediately evaluate the change.
For more additional information on how to perform the analysis, see Evaluate workflow and suitability modeling constraints.