The algorithm used by the Natural Neighbor interpolation tool finds the closest subset of input samples to a query point and applies weights to them based on proportionate areas to interpolate a value (Sibson 1981). It is also known as Sibson or "area-stealing" interpolation. Its basic properties are that it's local, using only a subset of samples that surround a query point, and interpolated heights are guaranteed to be within the range of the samples used. It does not infer trends and will not produce peaks, pits, ridges, or valleys that are not already represented by the input samples. The surface passes through the input samples and is smooth everywhere except at locations of the input samples.
Tip:
If you have the3D Analyst extension, you can use the TIN To Raster tool to incorporate breaklines into the interpolation. These can augment results of the interpolation, creating linear discontinuities where appropriate such as along roadsides and water bodies. It adapts locally to the structure of the input data, requiring no input from the user pertaining to search radius, sample count, or shape. It works equally well with regularly and irregularly distributed data (Watson 1992).
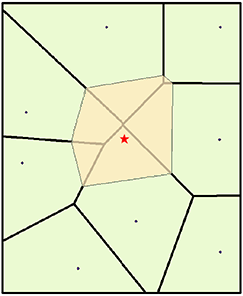
The natural neighbors of any point are those associated with neighboring Voronoi (Thiessen) polygons. Initially, a Voronoi diagram is constructed of all the given points, represented by the olive-colored polygons. A new Voronoi polygon, beige color, is then created around the interpolation point (red star). The proportion of overlap between this new polygon and the initial polygons is then used as the weights.

By comparison, a distance-based interpolator tool such as IDW (inverse distance weighted) would assign similar weights to the northernmost point and to the northeastern point based on their similar distance from the interpolation point. Natural neighbor interpolation, however, assigns weights of 19.12 percent and 0.38 percent, respectively, which is based on the percentage of overlap.
References
Sibson, R. "A Brief Description of Natural Neighbor Interpolation," chapter 2 in Interpolating Multivariate Data. New York: John Wiley & Sons, 1981. 21–36.
Watson, D. Contouring: A Guide to the Analysis and Display of Spatial Data. London: Pergamon Press, 1992.