Available with Standard or Advanced license.
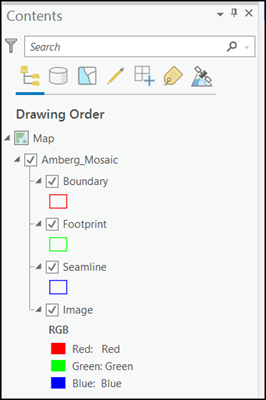
When you add a mosaic dataset to a map, the mosaic layer that appears in the Contents pane is a special group layer with a minimum of three layers by default: Boundary, Footprint, and Image. Optionally, Seamline will be included if it has been generated.

Each of these layers has its own layer properties and shortcut menu options that are specific to how you might interact with the mosaic dataset. Right-clicking the mosaic layer displays the shortcut menu options. There are several that are unique to the mosaic layer:
- Open Table
- Attribute Table—A table listing all the image items in the mosaic dataset, including information about each, such as the pixel sizes, source name, and different metadata.
- Raster Type Table—A table listing each raster type used in the mosaic dataset.
- Levels Table—Opens the pixel size levels table for the mosaic dataset.
- Logs Table—A table listing the processes performed on the mosaic dataset and their time duration, such as adding images, calculating cell size ranges, and building overviews.
- Stereo Table—A table listing the information pertaining to stereo data, such as overlap between images, stereo angles, and adjustment quality.
- Data
- Download Rasters—Download selected images from the layer’s catalog.
- Repair Mosaic Dataset Paths—Opens a dialog box allowing you to modify the paths to the image data used in the mosaic dataset.
- Analyze Mosaic Dataset—Opens the Analyze Mosaic Dataset tool to examine your mosaic dataset by looking for commonly known errors and warnings, and provides suggestions to optimize your mosaic dataset.
- Export Raster—Export images selected from a layer.
You can also access the many properties specific to the mosaic layer.
The Boundary layer displays the boundary of the mosaic dataset. By default, boundary is the extent of all the image datasets, defined by their footprints, within the mosaic dataset. The boundary can be modified to clip the extent of the mosaicked image of the mosaic dataset.
The Footprint layer displays the footprints for each image within the mosaic dataset, including overviews. From the Footprint layer, you can open the attribute table for the mosaic dataset. This table displays a list of all the images in the mosaic dataset and many of their properties, such as the minimum and maximum pixel sizes that are used to display the imagery in the mosaicked image. The table may also contain additional fields, often derived from metadata, that can be used when querying the mosaic dataset, such as acquisition date, sensor bands, collection angles, and more.
The Image layer controls the rendering of the mosaicked image similarly to an image layer. You can modify the display properties, such as the stretch, RGB band combination, resampling, mosaic method, and other properties.
The Seamline layer will be present if seamlines have been created or added to the mosaic dataset. Seamlines are another option (besides footprints) for controlling how the images are mosaicked together. When using the Seamline mosaic method, the mosaicked image will not change as you move around the image, which can occur when using mosaic methods such as Closest To Center. Also, when seamlines are created, you can ensure the best possible mosaic by editing the seamlines to avoid mosaicking across buildings having different angles in the overlap area, and that the seam between images is not obvious.