Available with Network Analyst license.
With the ArcGIS Network Analyst extension, you can answer questions like the following:
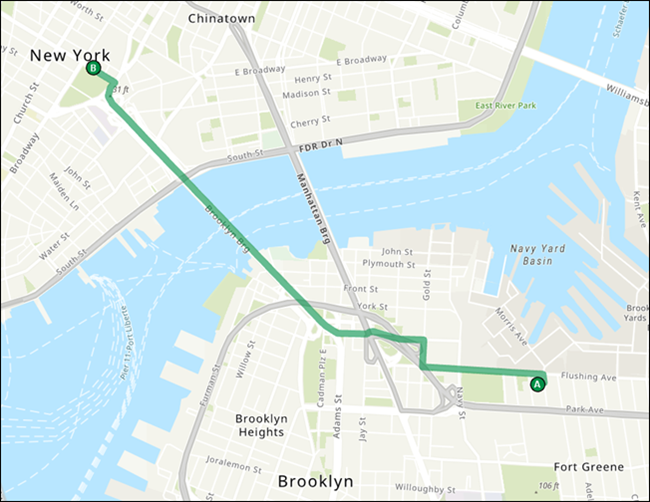
- What is the quickest way to get from point A to point B?
- What fire incidents can be reached within five minutes of fire stations?
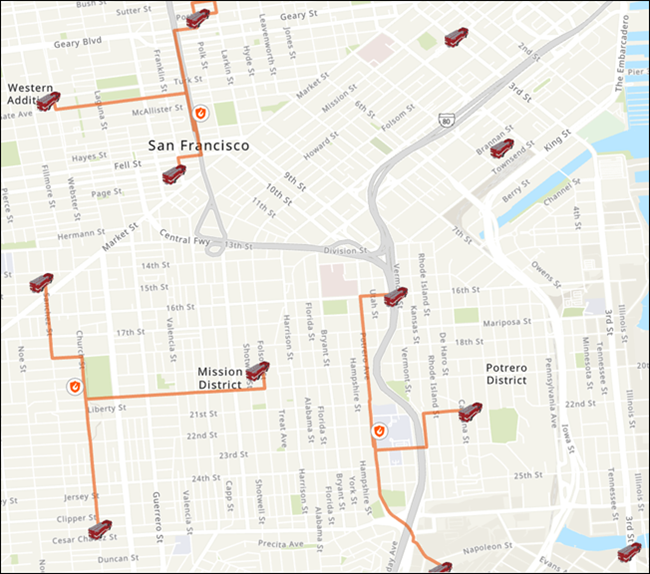
Find one or more facilities closest to an incident based on travel time, distance, or other cost and outputs the best route, chosen facility, and driving directions between the incident and the facility. In the above example, the solver finds the three closest fire stations that can respond to a fire incident within five minutes' drive time. Fire stations that are more than five minutes away are not included in the results. - What market areas does the business cover?
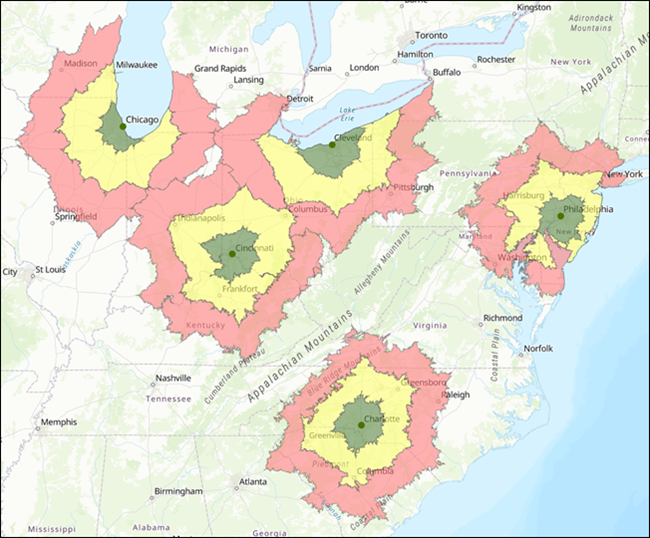
The green points represent warehouses in various cities, and the polygons represent their market areas, which are divided into three rings. The surrounding green polygons can be reached by trucks within one hour; yellow, within two hours; and red, within three hours. - What is the nearest coffee shop from my current location?
- Which patrol cars can respond the quickest to the incidents?
- How can we route our fleet of delivery vehicles to minimize overall transportation costs and improve customer service?
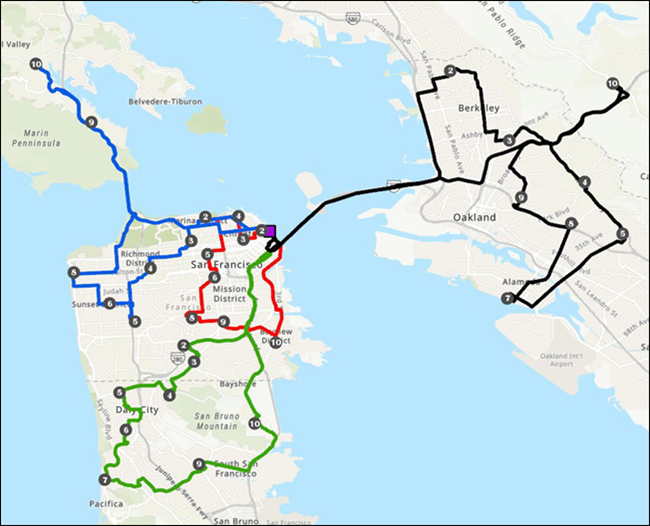
Food delivery trucks at a distribution center are assigned grocery stores and directions to the stores that minimize transportation costs. Vehicle capacities, lunch breaks, and maximum travel time constraints are included in the analysis. - Where should we open a new branch of our business to maximize market share?
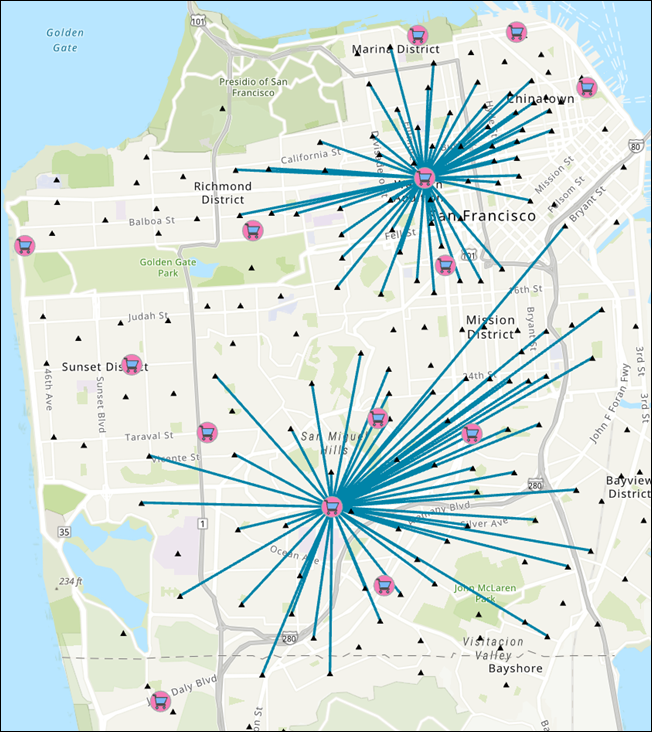
Location-allocation can be used to find the best locations from a set of input locations. In the above example, the tool evaluated the locations that meet the business needs for the establishment of new stores and identified the locations that capture the most demand from the overall market area. - Our company needs to downsize—which stores should we close to maintain the most overall demand?
- What are live or historical traffic conditions like, and how do they affect my network analysis results?
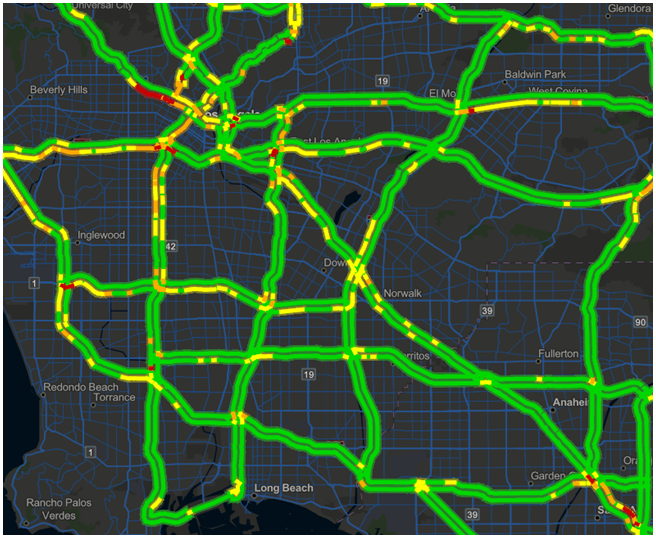
You can make use of live or historical traffic conditions so your analyses can account for changing traffic.
Benefits of using the ArcGIS Network Analyst extension
Businesses, public services, and other organizations benefit from the ArcGIS Network Analyst extension because it helps them run their operations more efficiently and improve strategic decision making. These organizations can better understand dynamic markets, both current and potential, once they know who can access their goods or services. Transportation costs can be reduced by optimally sequencing stops and finding the shortest paths between the stops while considering several constraints such as time windows, vehicle capacities, and maximum travel times. Customer service can be improved through quicker response times or more convenient facility locations. The ArcGIS Network Analyst extension facilitates understanding and solving problems of this nature.
Researchers and analysts commonly benefit from the extension's ability to determine the least-cost network paths between several origins and destinations. The origin-destination cost matrices that the ArcGIS Network Analyst extension creates often become input for larger analyses. For instance, predicting travel behavior frequently incorporates the distances people would need to travel to reach certain attractions. These network distances are applied in mathematical expressions to help make trip forecasts.
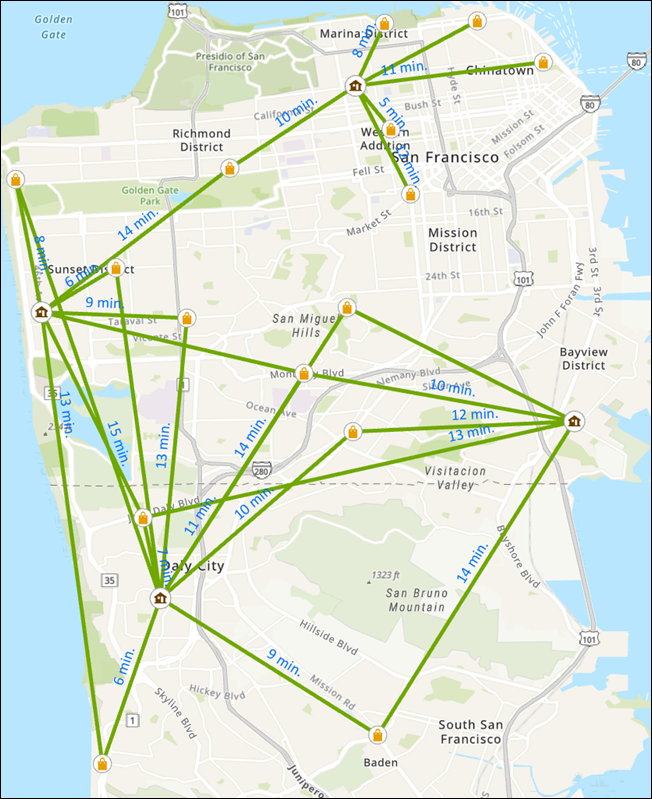
Similarly, some analyses in spatial statistics provide more accurate results when network distances are used in place of straight-line distances. Consider as an example traffic-incident analysis, which has the aim of locating clusters of traffic accidents, pinpointing their causes, and taking action to reduce the number of accidents. Since cars travel on roads, determining clusters of car accidents with network distances is far more effective than using straight-line distances.
Network analysis using web services
To perform network analyses and reap the benefits of knowing the answers to questions like those listed above, you need a network dataset, which models a transportation network. You can create your own network dataset, purchase one, or use network analysis services, such as the ones on ArcGIS Online or your own enterprise portal configured with routing services.
What is a network?
A network is a system of interconnected elements, such as edges (lines) and connecting junctions (points), that represent possible routes from one location to another.
People, resources, and goods tend to travel along networks: cars and trucks travel on roads, airliners fly on predetermined flight paths, and oil flows in pipelines. By modeling potential travel paths with a network, it is possible to perform analyses related to the movement of the oil, trucks, or other agents on the network. The most common network analysis is finding the shortest path between two points.
ArcGIS groups networks into two categories: utility networks and network datasets.
Utility networks (utility and river networks)
River networks and utility networks—like electrical, gas, sewer, and water lines—allow travel on edges in only one direction at a time. The agent in the network—for instance, the oil flowing in a pipeline—can't choose which direction to travel; rather, the path it takes is determined by external forces: gravity, electromagnetism, water pressure, and so on. An engineer can control the flow of the agent by controlling how external forces act on the agent.
Note:
River networks and utility networks, such as a pipeline, are best modeled in ArcGIS using utility networks, which are not part of the ArcGIS Network Analyst extension.
Network datasets (transportation networks)
Transportation networks—like street, pedestrian, and railroad networks—can allow travel on edges in both directions. The agent on the network—for instance, a truck driver traveling on roads—is generally free to decide the direction of traversal as well as the destination.
Note:
In ArcGIS, transportation networks are best modeled by network datasets.
License:
The ArcGIS Network Analyst extension is required to create and edit network datasets.
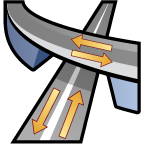
3D network datasets
Three-dimensional network datasets enable you to model the interior pathways of buildings, mines, caves, and so on.
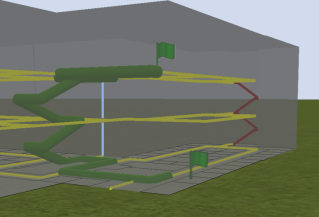
If you have street features with accurate z-coordinate values, you can use them with z-aware features that model pathways inside buildings to create 3D networks of campuses or even cities. This allows you to answer questions such as the following:
- What is the best wheelchair-accessible route between rooms in different buildings?
- What floors of a high-rise building can't be reached by a fire department within eight minutes?