Calculate cell statistics when you want to calculate a statistic between multiple rasters. For instance, use the tools to analyze a certain phenomenon over time: for example, determine the yearly mean or minimum rainfall for a 25-year period for allocating agricultural aid money or calculate the range of temperatures between years to understand global warming.
Examples
Land-use change over time
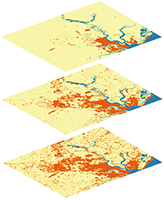
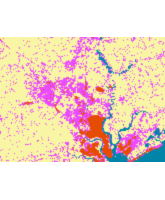
In the graphic below, the variety of land-use types between cells of rasters from different years is calculated to identify the areas where the variety is greater than one (areas shaded gray). This indicates the areas that have changed land-use type over the time period, in this case highlighting areas of urban sprawl (areas shaded orange).
In the graphic below, the urban land-use type (shaded in orange) is shown for successive decades. The variety of variety of land-use types between the cells of rasters from the different time periods years is calculated to identify the areas where the variety is greater than one (areas shaded magenta). This indicates the areas that have changed land-use type over the time period, in this case highlighting areas of urban sprawl.


Average annual crop yields
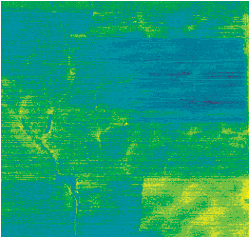
In the image below, the average crop yield from 1980 to 1990 is derived from 10 input rasters, each representing the yearly corn yield for 1 year of the 10-year period.
