Spatial Association Between Zones (Spatial Statistics)

Summary

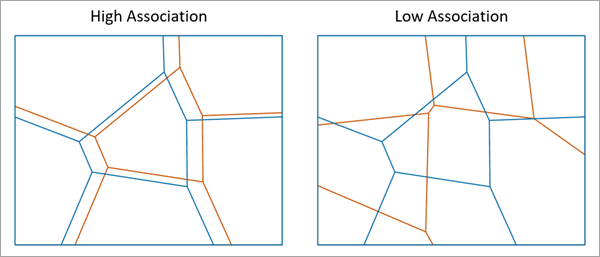
Measures the degree of spatial association between two regionalizations of the same study area in which each regionalization is composed of a set of categories, called zones. The association between the regionalizations is determined by the area overlap between zones of each regionalization. The association is highest when each zone of one regionalization closely corresponds to a zone of the other regionalization. Similarly, spatial association is lowest when the zones of one regionalization have large overlap with many different zones of the other regionalization. The primary output of the tool is a global measure of spatial association between the categorical variables: a single number ranging from 0 (no correspondence) to 1 (perfect spatial alignment of zones). Optionally, this global association can be calculated and visualized for specific zones of either regionalization or for specific combinations of zones between regionalizations.

For example, you can use this tool to compare two sets of categorical zones, such as the crop type and soil drainage class of an agricultural area to measure how closely particular crops correspond to a specific class of soil drainage. However, you can also use this tool to measure the degree of change of the same categorical zones over time. For example, climate zones from 1990 can be compared to climate zones from 2020 to measure how much the climate zones changed over three decades. Using optional outputs, you can determine how each individual climate zone changed, such as whether arid climate zones expanded into areas that were previously semiarid.

Learn more about how Spatial Association Between Zones works

Illustration

Spatial Association Between Zones tool illustration
Examples of high and low association between blue and orange zones are shown.

Usage

  • The zones of the first regionalization are called the input zones, and the zones of the second regionalization are called the overlay zones. Each set of zones can be supplied as polygon features or as a raster along with a field indicating the category of each polygon feature or raster cell. All features or cells sharing the same value of the categorical zone field are considered to be in the same zone.

  • By default, the output of the tool is three numbers, each measuring a different type of global association. The values are displayed in the geoprocessing messages and returned as derived outputs. These derived outputs can be referenced as variables in Python scripts (as shown in the second code sample below) or used as inputs to other tools in ModelBuilder. The three measures of association are the following:

    • Global Measure of Association—A measure of the overall association between the input and overlay zones. The value ranges from 0 (no association) to 1 (perfect correspondence). The value does not depend on which of the two regionalizations are the input and overlay zones (if the input and overlay zones are reversed, this value will not change). The statistic is determined by the harmonic mean of the following two global association measures.
    • Global Correspondence of Overlay Zones within Input Zones—A measure of the consistency of the categories of the overlay within each of the input zones ranging from 0 to 1. A value of 1 indicates that every input zone contains only a single overlay zone within it (perfect correspondence of zones). Values close to 0 indicate that the input zones are evenly divided into many categories of the overlay zones (low correspondence to a single overlay zone).
    • Global Correspondence of Input Zones within Overlay Zones—A measure of the consistency of the categories of the input within each of the overlay zones. This value is analogous to the other global correspondence value, but it measures the variability of the input zones within the overlay zones. These two measures switch values if the input zones and overlay zones are reversed.

  • The global correspondence measures can be partitioned spatially into each intersection of the input and overlay zones. Each of these intersections measures the correspondence of a particular combination of input and overlay zone, such as an individual crop type and an individual soil drainage class. These specific combinations can be created using the Output Features parameter or the Output Raster parameter, depending on whether the zones are polygon features or rasters. Each of these outputs includes two charts. The first chart shows a side-by-side bar chart of the area overlap of the overlay zones within each of the input zones. The second chart analogously shows bar charts of the area overlap of the input zones within each of the overlay zones. These charts allow you to investigate whether a specific zone corresponds well to a single zone of the other regionalization, such as a correspondence between corn and well-drained soil.

    These intersections can also be aggregated into each of the input or overlay zones using the Correspondence of Overlay Zones within Input Zones and Correspondence of Input Zones within Overlay Zones parameters, respectively, if the input and overlay zones are polygons. For rasters, these aggregations are stored as fields of the output raster. These outputs allow you to measure the overall correspondence of one specific input or overlay zone to all zones of the other regionalization simultaneously. This allows you to identify specific zones with high or low overall correspondence to the other regionalization. These zones can be further investigated by looking at all of the individual intersections of that zone to determine which zone combinations are driving the overall high or low correspondence.

    Unlike the global association and correspondence measures, smaller values of the local correspondence measures indicate higher correspondence. The minimum value of 0 indicates perfect correspondence, and the local measures have no upper bound, but they are rarely greater than 2.

  • An ArcGIS Spatial Analyst extension license is required to use rasters as inputs or outputs of the tool.

  • The input and overlay zones must intersect to calculate measures of association. Any zone of one regionalization that does not intersect at least one zone of the other regionalization will not be included in the calculations.

  • For more information and mathematical details, see the following reference:

    • Nowosad, J., Stepinski, T. F. (2018). "Spatial association between regionalizations using the information-theoretical V-measure." International Journal of Geographical Information Science. https://doi.org/10.1080/13658816.2018.1511794

Parameters

LabelExplanationData Type
Input Polygon Feature or Raster Zones

The dataset representing the zones of the first regionalization. The zones can be defined using polygon features or a raster.

Feature Layer; Raster Layer; Image Service
Categorical Zone Field

The field representing the zone category of the input zones. Each unique value of this field defines an individual zone. For features, the field must be integer or text. For rasters, the VALUE field is also supported.

Field
Overlay Polygon Feature or Raster Zones

The dataset representing the zones of the second regionalization. The zones can be polygon features or a raster.

Feature Layer; Raster Layer; Image Service
Categorical Overlay Zone Field

The field representing the zone category of the overlay zones. Each unique value of this field defines an individual zone. For features, the field must be integer or text. For rasters, the VALUE field is also supported.

Field
Output Features
(Optional)

The output polygon features containing spatial association measures at all intersections of the input and overlay zones.

The output features can be used to measure the association between specific combinations of input and overlay zones, such as the association between areas of corn production (crop type) and areas of well-drained soil (soil drainage class). This parameter is only enabled if the input and overlay zones are both polygon features.

Feature Class
Output Raster
(Optional)

The output raster containing spatial association measures between the input and overlay zones.

The output raster will have three fields to indicate the spatial association measures for intersections of the input and overlay zones, correspondence of overlay zones within input zones, and correspondence of input zones within overlay zones. This parameter is only enabled if at least one of the input and overlay zones is a raster.

Raster Dataset
Correspondence of Overlay Zones within Input Zones
(Optional)

The output polygon features containing the correspondence measures of the overlay zones within the input zones.

This output will have the same geometry as the input zones and can be used to identify which input zones closely correspond overall to the overlay zones. Specific zone combinations can then be investigated with the output features. This parameter is only enabled if the input and overlay zones are both polygon features.

Feature Class
Correspondence of Input Zones within Overlay Zones
(Optional)

The output polygon features containing the correspondence measures of the input zones within the overlay zones.

This output will have the same geometry as the overlay zones and can be used to identify which overlay zones closely correspond overall to the input zones. Specific zone combinations can then be investigated with the output features. This parameter is only enabled if the input and overlay zones are both polygon features.

Feature Class

Derived Output

LabelExplanationData Type
Global Measure of Spatial Association

The measure of global association between the input and overlay zones. The value ranges from 0 (no association) to 1 (perfect association).

Double
Global Correspondence of Overlay Zones within Input Zones

The measure of global correspondence of the overlay zones within the input zones. The value cannot be negative, and values closer to zero indicate higher correspondence (less variability).

Double
Global Correspondence of Input Zones within Overlay Zones

The measure of global correspondence of the input zones within the overlay zones. The value cannot be negative, and values closer to zero indicate higher correspondence (less variability).

Double

arcpy.stats.SpatialAssociationBetweenZones(input_feature_or_raster, categorical_zone_field, overlay_feature_or_raster, categorical_overlay_zone_field, {output_features}, {output_raster}, {correspondence_overlay_to_input}, {correspondence_input_to_overlay})
NameExplanationData Type
input_feature_or_raster

The dataset representing the zones of the first regionalization. The zones can be defined using polygon features or a raster.

Feature Layer; Raster Layer; Image Service
categorical_zone_field

The field representing the zone category of the input zones. Each unique value of this field defines an individual zone. For features, the field must be integer or text. For rasters, the VALUE field is also supported.

Field
overlay_feature_or_raster

The dataset representing the zones of the second regionalization. The zones can be polygon features or a raster.

Feature Layer; Raster Layer; Image Service
categorical_overlay_zone_field

The field representing the zone category of the overlay zones. Each unique value of this field defines an individual zone. For features, the field must be integer or text. For rasters, the VALUE field is also supported.

Field
output_features
(Optional)

The output polygon features containing spatial association measures at all intersections of the input and overlay zones.

The output features can be used to measure the association between specific combinations of input and overlay zones, such as the association between areas of corn production (crop type) and areas of well-drained soil (soil drainage class). This parameter is only enabled if the input and overlay zones are both polygon features.

Feature Class
output_raster
(Optional)

The output raster containing spatial association measures between the input and overlay zones.

The output raster will have three fields to indicate the spatial association measures for intersections of the input and overlay zones, correspondence of overlay zones within input zones, and correspondence of input zones within overlay zones. This parameter is only enabled if at least one of the input and overlay zones is a raster.

Raster Dataset
correspondence_overlay_to_input
(Optional)

The output polygon features containing the correspondence measures of the overlay zones within the input zones.

This output will have the same geometry as the input zones and can be used to identify which input zones closely correspond overall to the overlay zones. Specific zone combinations can then be investigated with the output features. This parameter is only enabled if the input and overlay zones are both polygon features.

Feature Class
correspondence_input_to_overlay
(Optional)

The output polygon features containing the correspondence measures of the input zones within the overlay zones.

This output will have the same geometry as the overlay zones and can be used to identify which overlay zones closely correspond overall to the input zones. Specific zone combinations can then be investigated with the output features. This parameter is only enabled if the input and overlay zones are both polygon features.

Feature Class

Derived Output

NameExplanationData Type
global_measure_of_spatial_association

The measure of global association between the input and overlay zones. The value ranges from 0 (no association) to 1 (perfect association).

Double
global_correspondence_overlay_to_input

The measure of global correspondence of the overlay zones within the input zones. The value cannot be negative, and values closer to zero indicate higher correspondence (less variability).

Double
global_correspondence_input_to_overlay

The measure of global correspondence of the input zones within the overlay zones. The value cannot be negative, and values closer to zero indicate higher correspondence (less variability).

Double

Code sample

SpatialAssociationBetweenZones example 1 (Python window)

The following Python window script demonstrates how to use the SpatialAssociationBetweenZones function.


import arcpy
arcpy.stats.SpatialAssociationBetweenZones("forest_type", "Class_Name", 
               "soil_drainage", "ClassName", None, 
               "forest_soil", None, None)
SpatialAssociationBetweenZones example 2 (stand-alone script)

The following stand-alone Python script demonstrates how to use the SpatialAssociationBetweenZones function.


# Calculate the association between forest type and soil drainage class rasters.  

import arcpy 

# Set the current workspace
arcpy.env.workspace = r"c:\data\project_data.gdb"
arcpy.env.overwriteOutput = True

# Determine the association.
result = arcpy.stats.SpatialAssociationBetweenZones("forest_type", "Class_Name", 
               "soil_drainage", "ClassName", None, "forest_soil")

# Print the derived output for the Global Measure of Spatial Association.
globalV = result[4]
if globalV > 0.9:
    print('Forest type and soil drainage class are highly associated.')

Environments

Special cases

Extent

This environment only impacts the output raster.

Cell Size

This environment only impacts the output raster.

Cell Size Projection Method

This environment only impacts the output raster.

Mask

This environment only impacts the output raster.

Snap Raster

This environment only impacts the output raster.