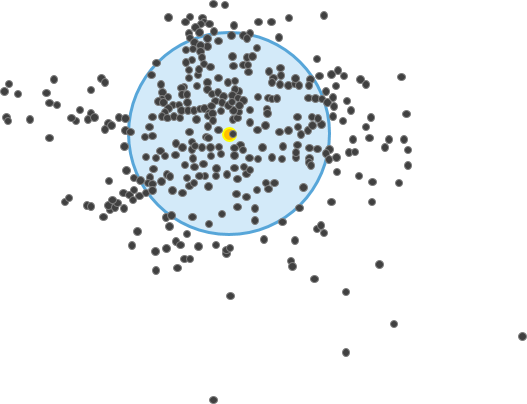
Calculations
The Standard Distance is given as:

Where x i , y i and z i are the coordinates for feature i , {x̄, ȳ, z̄} represents the Mean Center for the features, and n is equal to the total number of features.
The Weighted Standard Distance extends to the following:

Where wi is the weight at feature i and {x w, y w, z w} represents the weighted Mean Center.
Output

Potential applications
- You can use the values for two or more distributions to compare them. A crime analyst, for example, could compare the compactness of assaults and auto thefts. Knowing how the different types of crimes are distributed may help police develop strategies for addressing the crime. If the distribution of crimes in a particular area is compact, stationing a single car near the center of the area might suffice. If the distribution is dispersed, having several police cars patrol the area might be more effective in responding to the crimes.
- You can also compare the same type of feature over different time periods—for example, a crime analyst could compare daytime and nighttime burglaries to see if burglaries are more dispersed or more compact during the day than at night.
- You can also compare the distributions of features to stationary features. For example, you could measure the distribution of emergency calls over several months for each responding fire station in a region and compare them to see which stations respond over a wider area.
Additional resources
Mitchell, Andy. The ESRI Guide to GIS Analysis, Volume 2. ESRI Press, 2005.