Overview
The Contour function generates contour lines by joining points with the same elevation from a raster elevation dataset. The contours are isolines created as rasters for visualization.
The following key features make this function powerful:
- Contours are quickly and dynamically generated on very large datasets, such as the World Elevation.
- Contours can be smoothed to provide a more cartographic-pleasing appearance while maintaining the accuracy of the contours.
- Dynamic control over the contour interval is provided.
- Output options include contour lines, index contours, and filled contours.
Notes
The creation of a contour layer as a raster product is valuable for a wide range of applications since the contours can be overlaid on a map and provide information regarding the terrain without obscuring the underlying data. They are useful in applications such as engineering, agriculture, and water management.
The contours produced by this function are rasters and, therefore, not easily labeled. Contour labels on digital maps are often not required, and the contour layer is often used to give terrain context to underlying maps and images.
The contours generated from the elevation dataset are rasters with a value of one (1). The bold index contour has a value of two (2). Use Identify to display the elevation value of the contour based on the source elevation layer, which will return the elevation of the contour, point, key features, and spot heights on the maps and images.
The contours interval can be defined as a static value or set to be dynamic with the Number of Contours parameter, and it automatically varies based on the undulations of the terrain in the display. In the dynamic mode, the approximate number of contours to be displayed is defined, and the function computes the appropriate contour interval while maintaining standardized intervals such as 1, 5, 10, and so on. The Number of Contours parameter setting disables the Contour Interval parameter.
When Contour Type is set to Contour smooth only, the input elevation layer is smoothed using the adaptive filter but does not produce contours. The smoothed output layer can then be exported and input to a variety of tools in the Raster Surface toolset or a vector Contour tool.
For an example of how to adjust the function parameters to achieve a particular result, consider an input raster in WGS_84 geographic coordinates and elevation units of meters for which you want to generate contour lines every 100 feet with a base of 50 feet (so the contours will be 50 feet, 150 feet, 250 feet, and so on). To do this, set the Contour Interval to 100, the Base Contour to 50, and the Z factor to 3.2808.
Parameters
| Parameter name | Description |
|---|---|
Raster | A single band raster elevation dataset. |
Adaptive Smoothing | The amount of smoothing to apply to the contour line. The default value is 2.5. A lower value produces a contour line with more granularity and less smoothing, while a higher value produces a contour line with more smoothing that appears less jagged. |
Contour Type | The type of contour to be created:
|
Z Base | The base contour value. Contours are generated above and below this value as needed to cover the entire value range of the input raster. The default is 0. A value of 0 often represents mean sea level, depending on the source elevation dataset. |
Number Of Contours | The number of contours to be generated in the display. This dynamically adjusts the contour interval to fit the terrain in the display while maintaining standardized intervals such as 1, 5, 10, and so on. |
Contour Interval | The difference in altitude between contour lines. A small contour interval is used in relatively flat areas, while larger contour intervals are used in variable or mountainous terrain. |
Nth Contour Line In Bold | The index contour, which is represented as a bold line. The default value is 5; thus, every 5th contour line is bold. |
Z Factor | The unit conversion factor used when generating contours. The default value is 1. The contour lines are generated based on the z-values in the input raster, which are often measured in units of meters or feet. With the default value of 1, the contours will be in the same units as the z-values of the input raster. To create contours in a different unit than that of the z-values, set an appropriate value for the z-factor. Note that it is not necessary to have the ground x,y and surface z-units be consistent for this tool. For example, if the elevation values in your input raster are in feet, but you want the contours to be generated based on units of meters, set the z-factor to 0.3048 (since 1 foot = 0.3048 meters). |
More about the Contour function
Cartographically smoothed contours
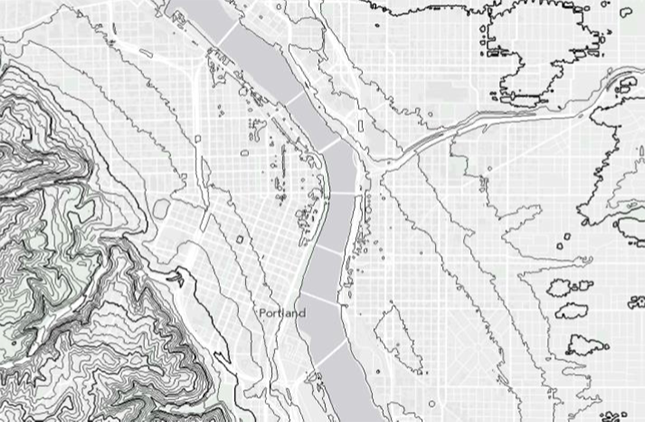
A key feature of the Contour function is the ability to generate cartographically enhanced contours in which jagged artifacts are removed. With the increased availability of accurate and high resolution elevation sources, contours generated from these sources often contain very jagged artifacts.
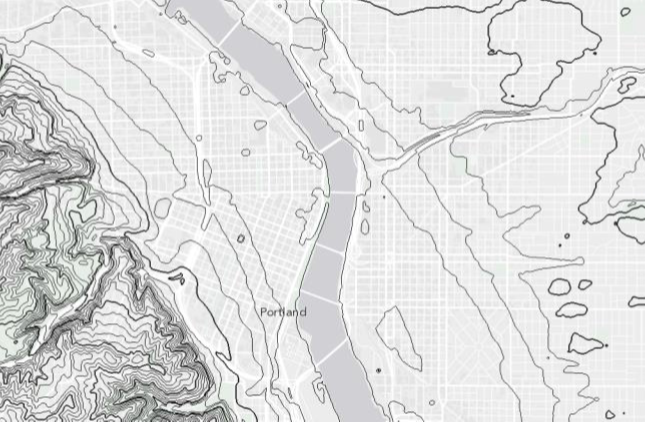
The examples below illustrate the effect of smoothing, The first example has no smoothing applied, while the contours in the second example have been smoothed using adaptive filtering. The smoothed contours are much more cartographically pleasing, while still correct.


Contours are typically smoothed when producing cartographic products. The smoothing needs to represent the terrain as accurately as possible, especially when variable terrain includes flat and steep areas, and abrupt changes in topography. It is, therefore, not suitable to simply apply a median smoothing filter over the terrain. Smoothing contours lines accurately is a complex and time consuming process, and the Contour function employs an adaptive smooth algorithm to the digital elevation model (DEM) prior to contour generation. The smoothing can be considered a form of median filter that changes in size depending on slope. Flatter areas are smoothed more than steeper areas so that jagged artifacts are removed from flatter areas while maintaining required details with increasing slope. The result of the adaptive filtering is that streams, ridges, hill tops, and other important physiographic features remain well represented.
Vector contours
If smoothed vector contours are required in a feature class format, they can be created in two steps. First, use the Contour smooth only type as illustrated below, and either export the resulting DEM as a raster saved to disk, or save a raster layer that includes the result from the Contour smooth only option. Then, use the Contour function available in ArcGIS Spatial Analyst extension to generate the vector contours with the smoothed DEM or raster layer as input. The resulting contours will have the same form as those generated by the raster function. The vector contours can then be labelled if required.
Filled contours
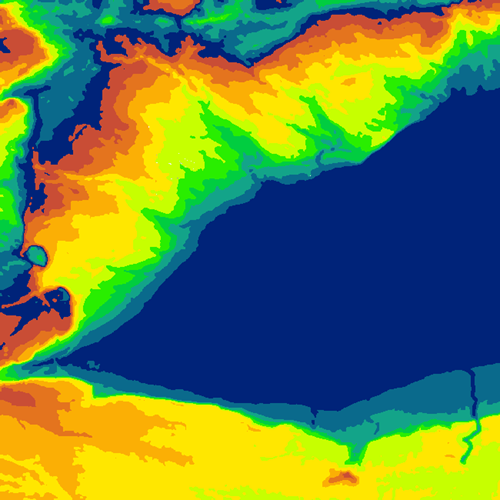
The function also has an option for generating filled contour regions. Essentially, instead of the space between contours being NoData, they are filled with a value that represents the quantized elevation value. The filled contours can also be combined with the Sigma Gaussian adaptive smoothing filter.
